What makes a dashboard section readable?
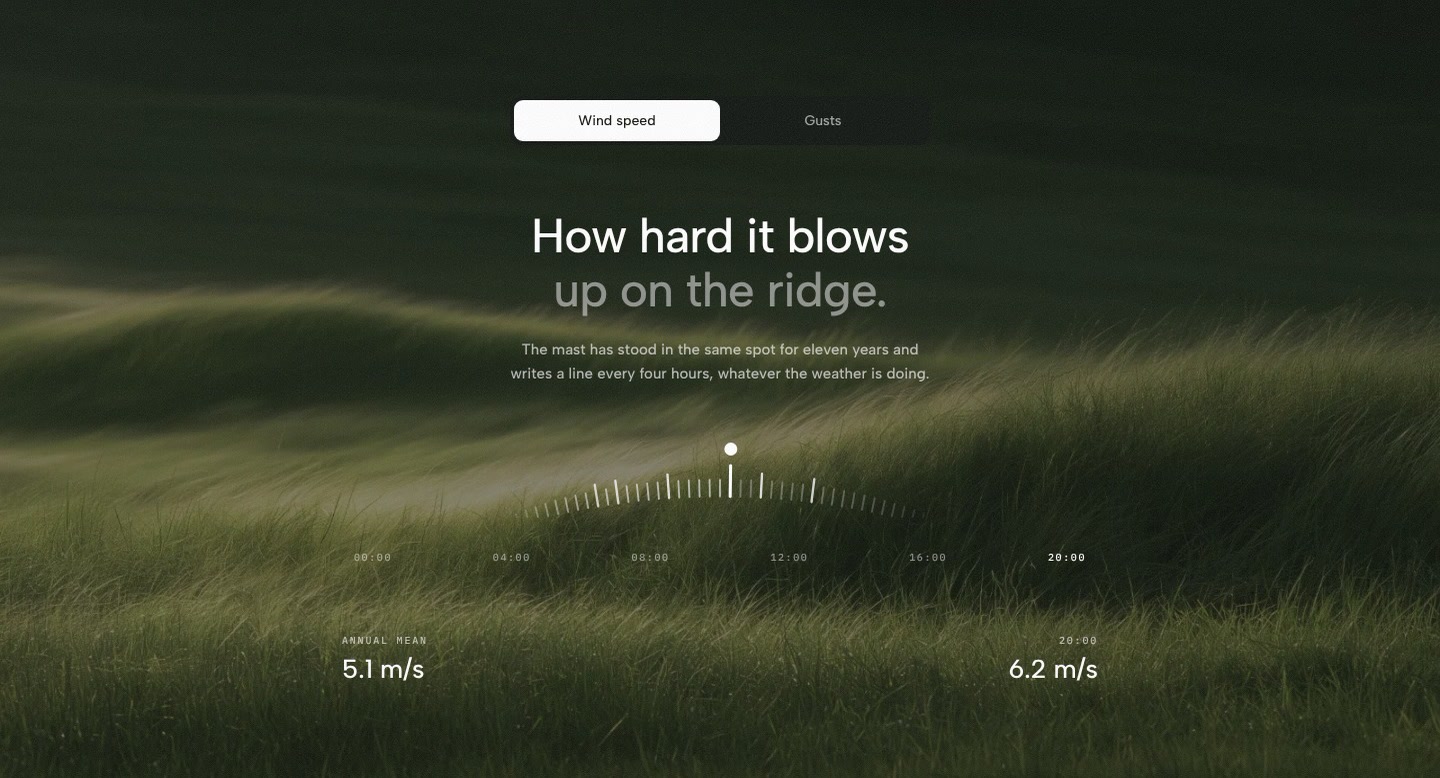
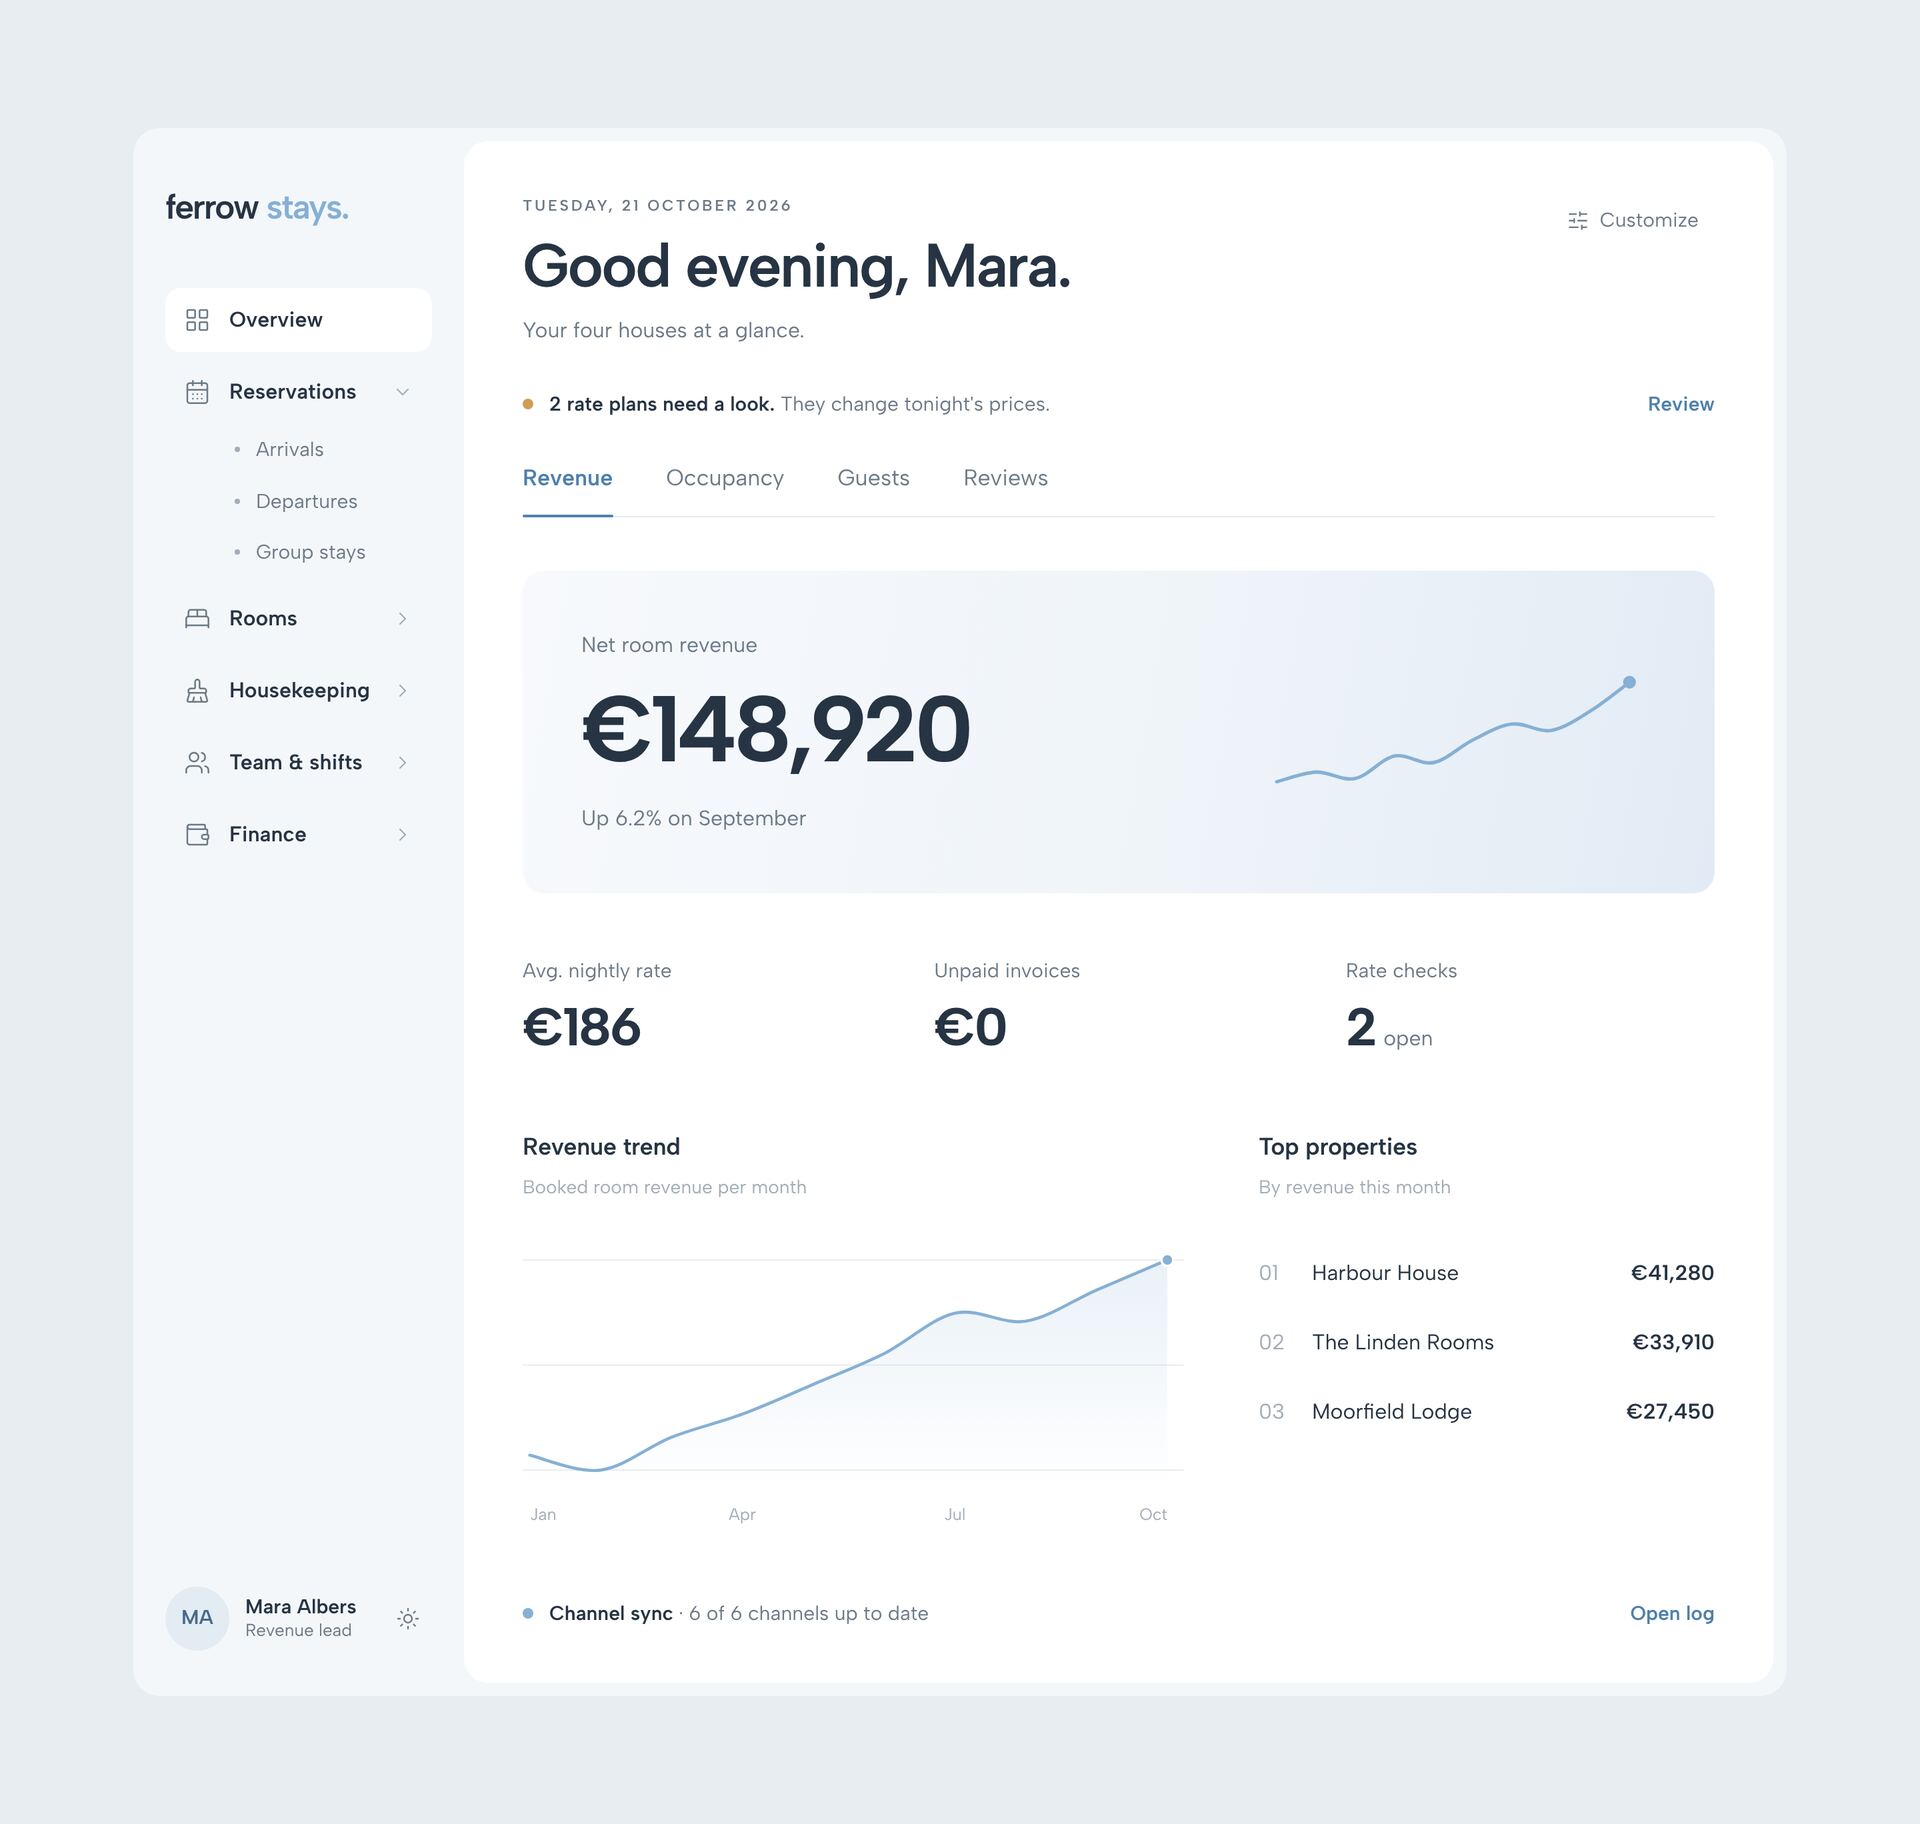
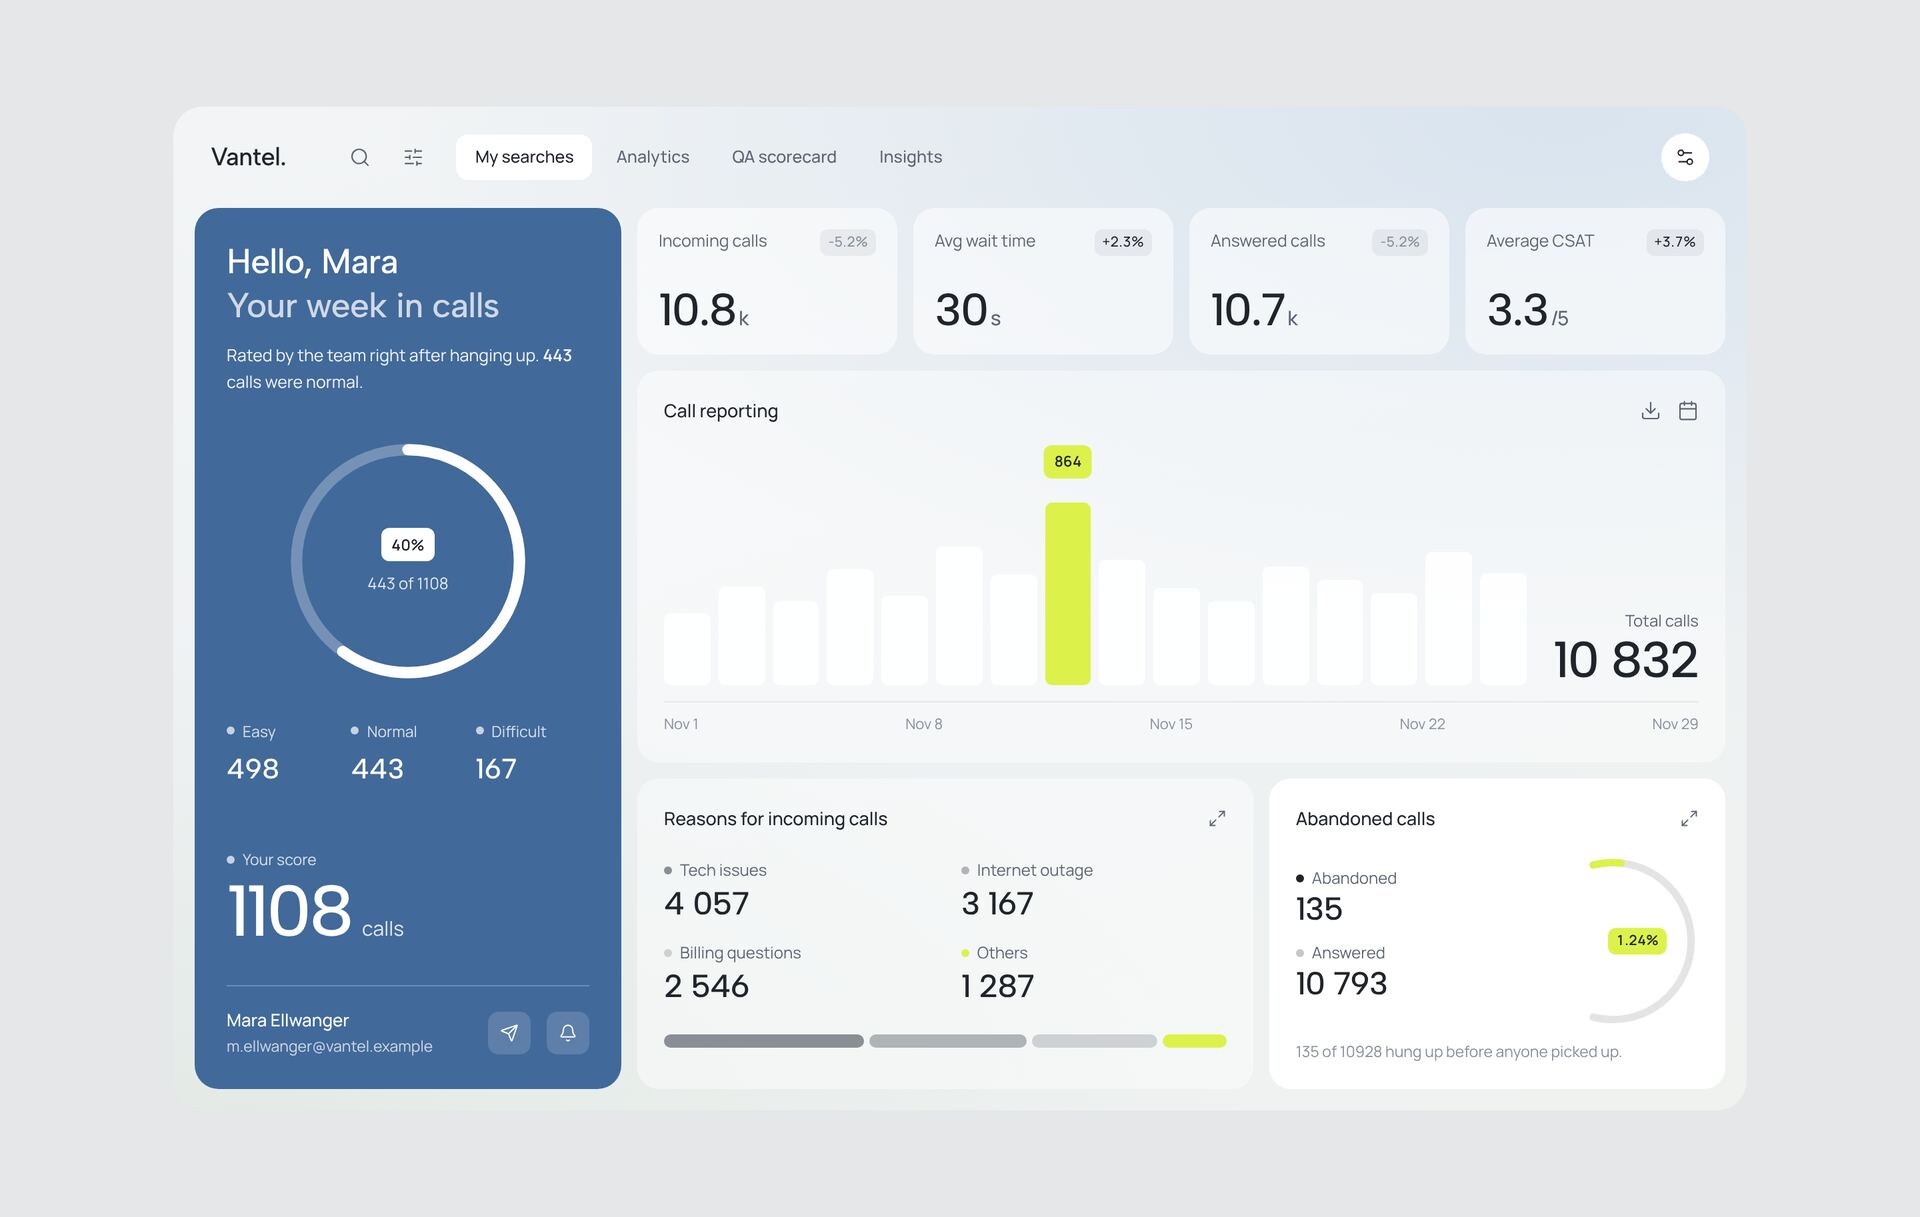
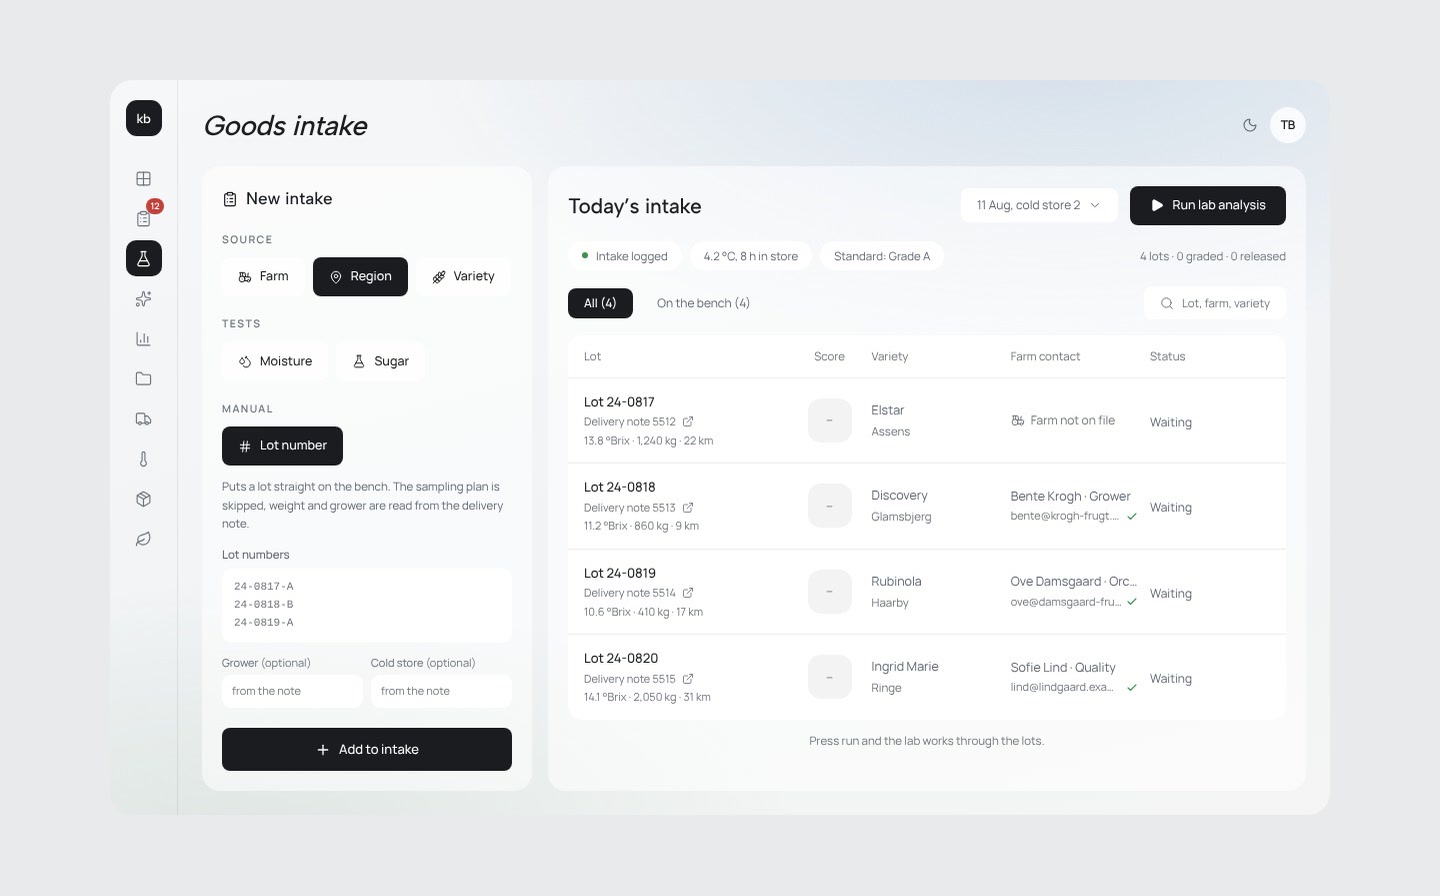
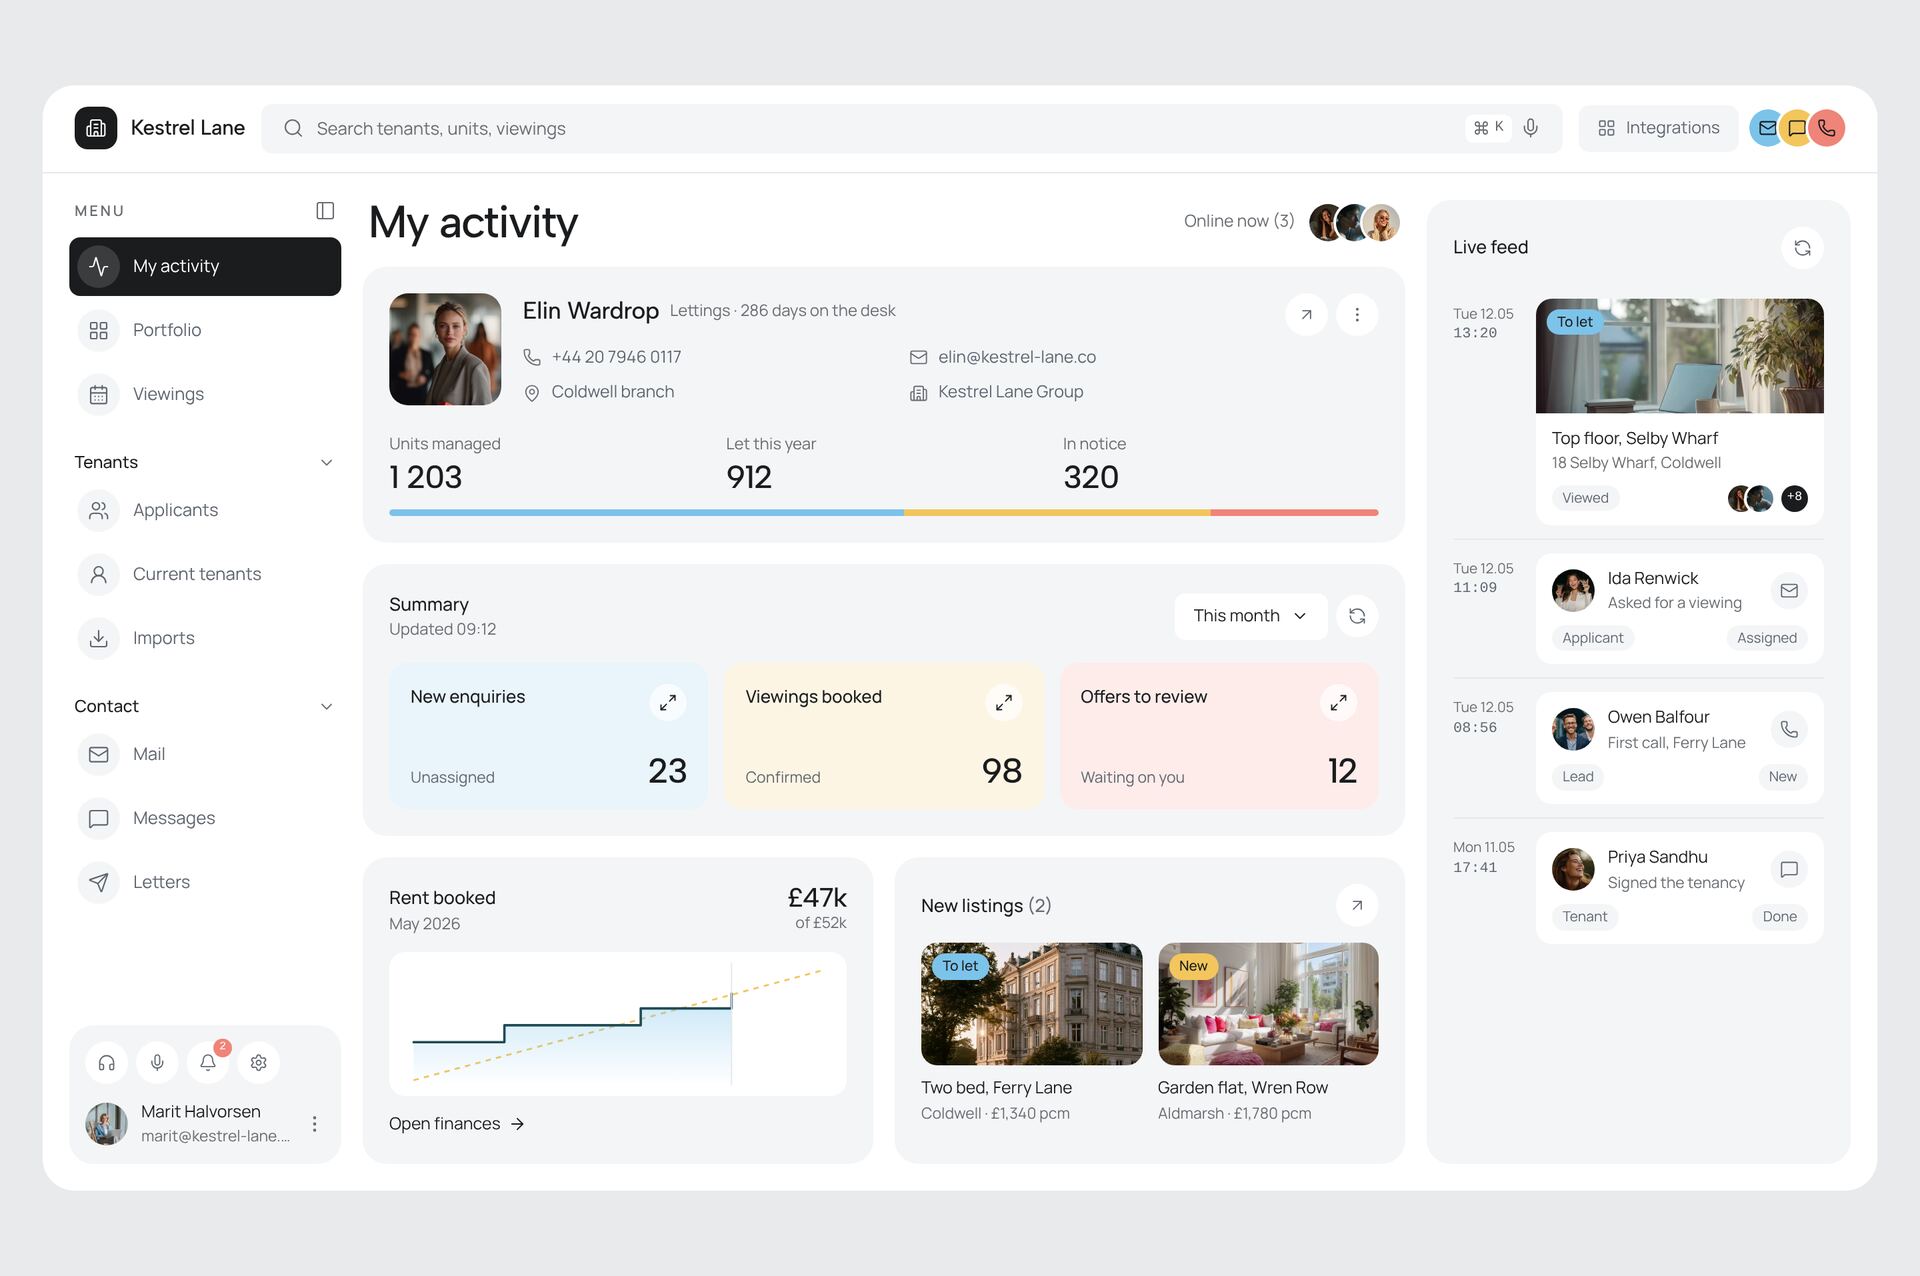
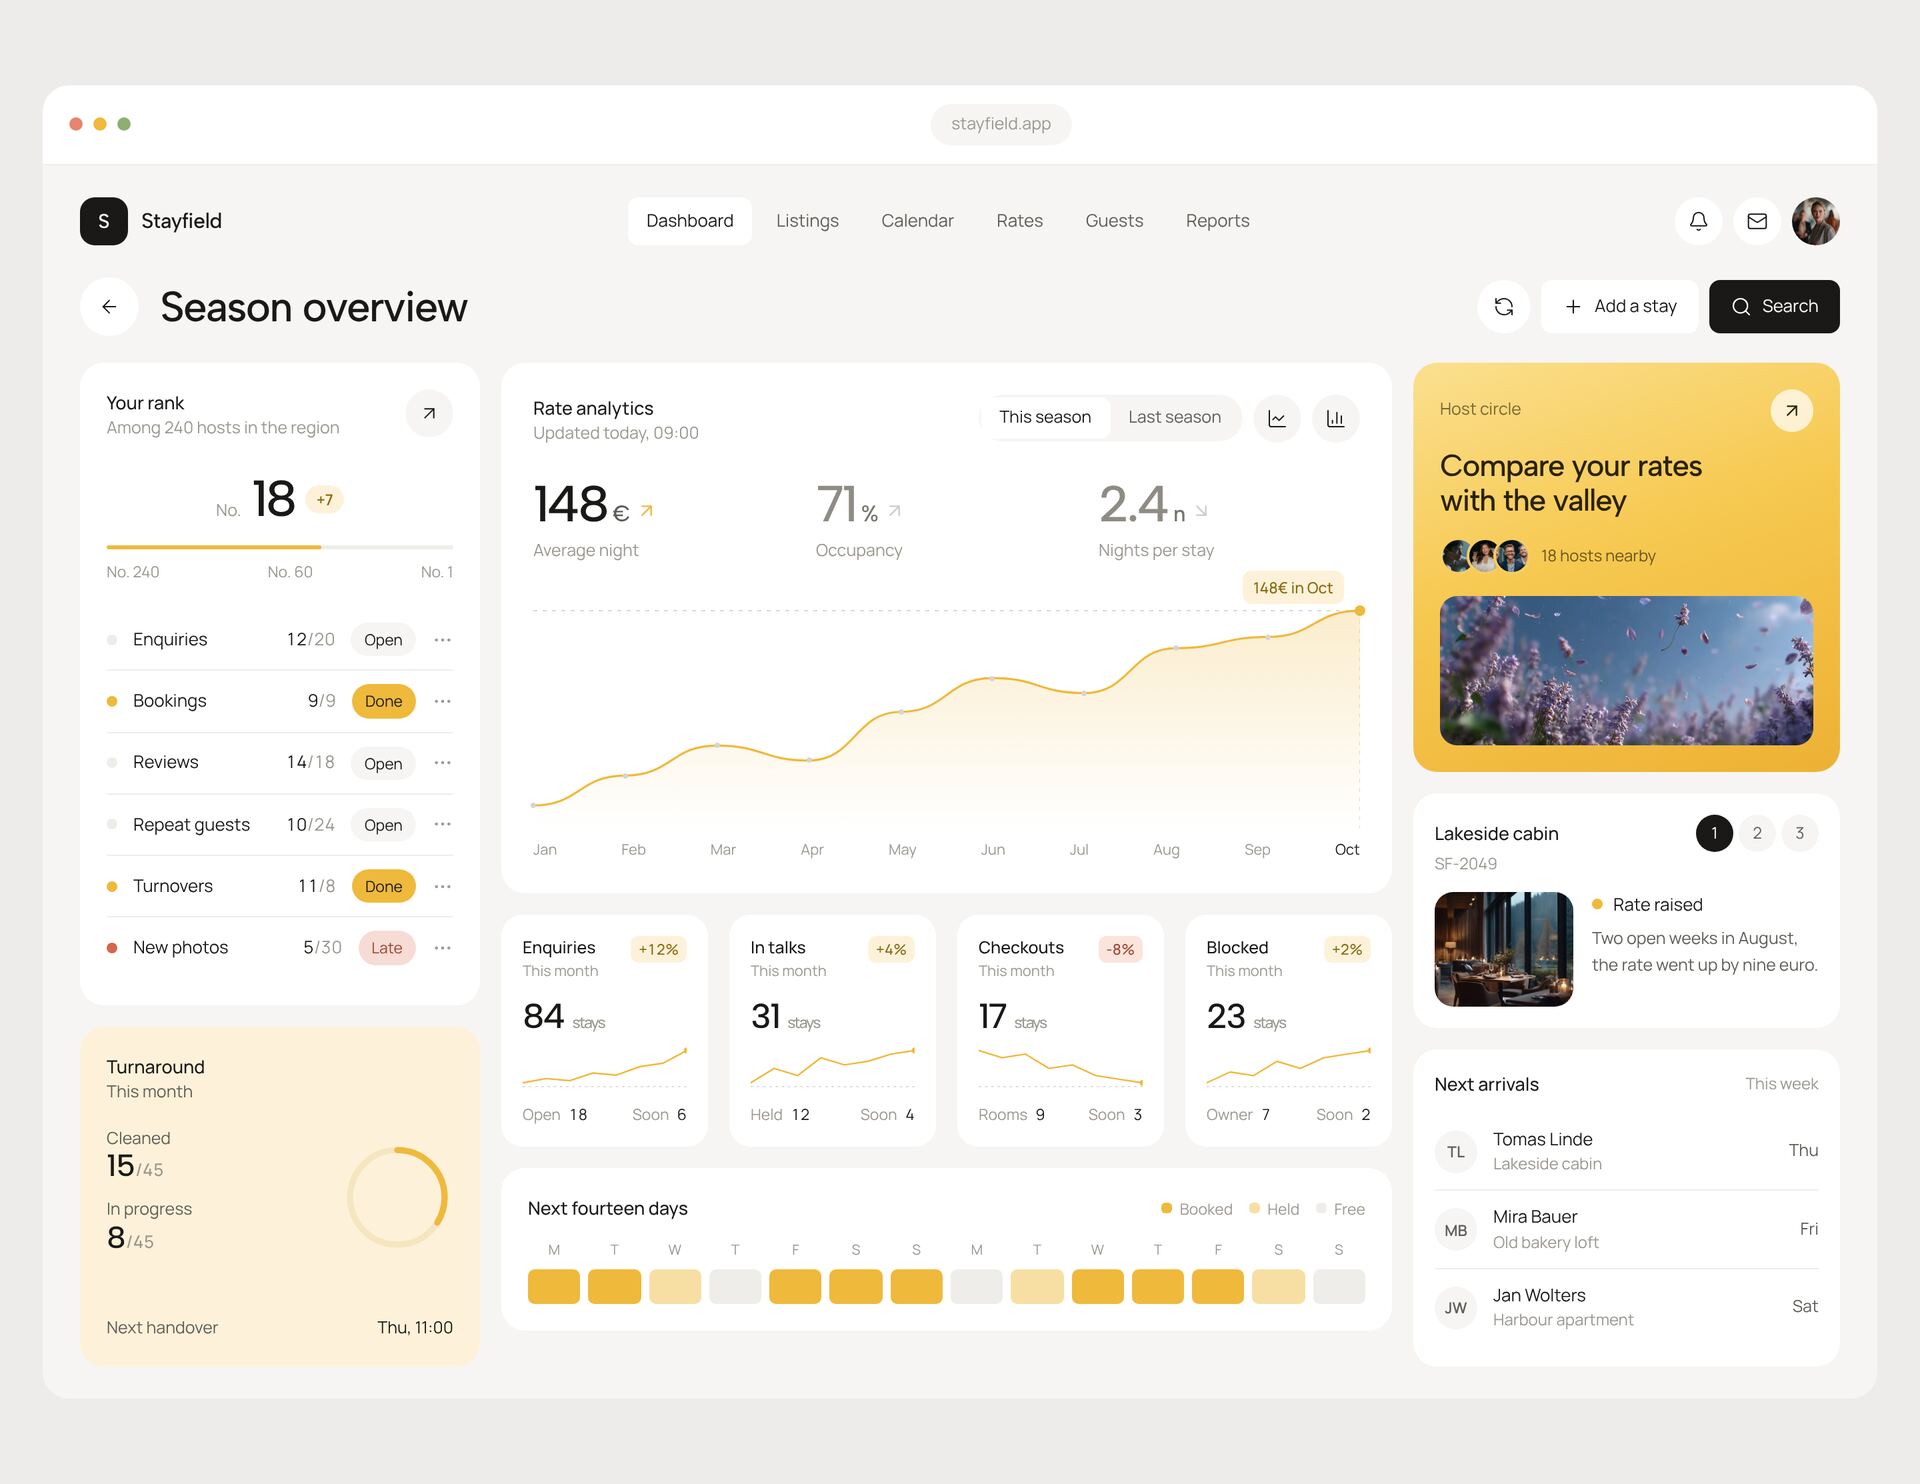
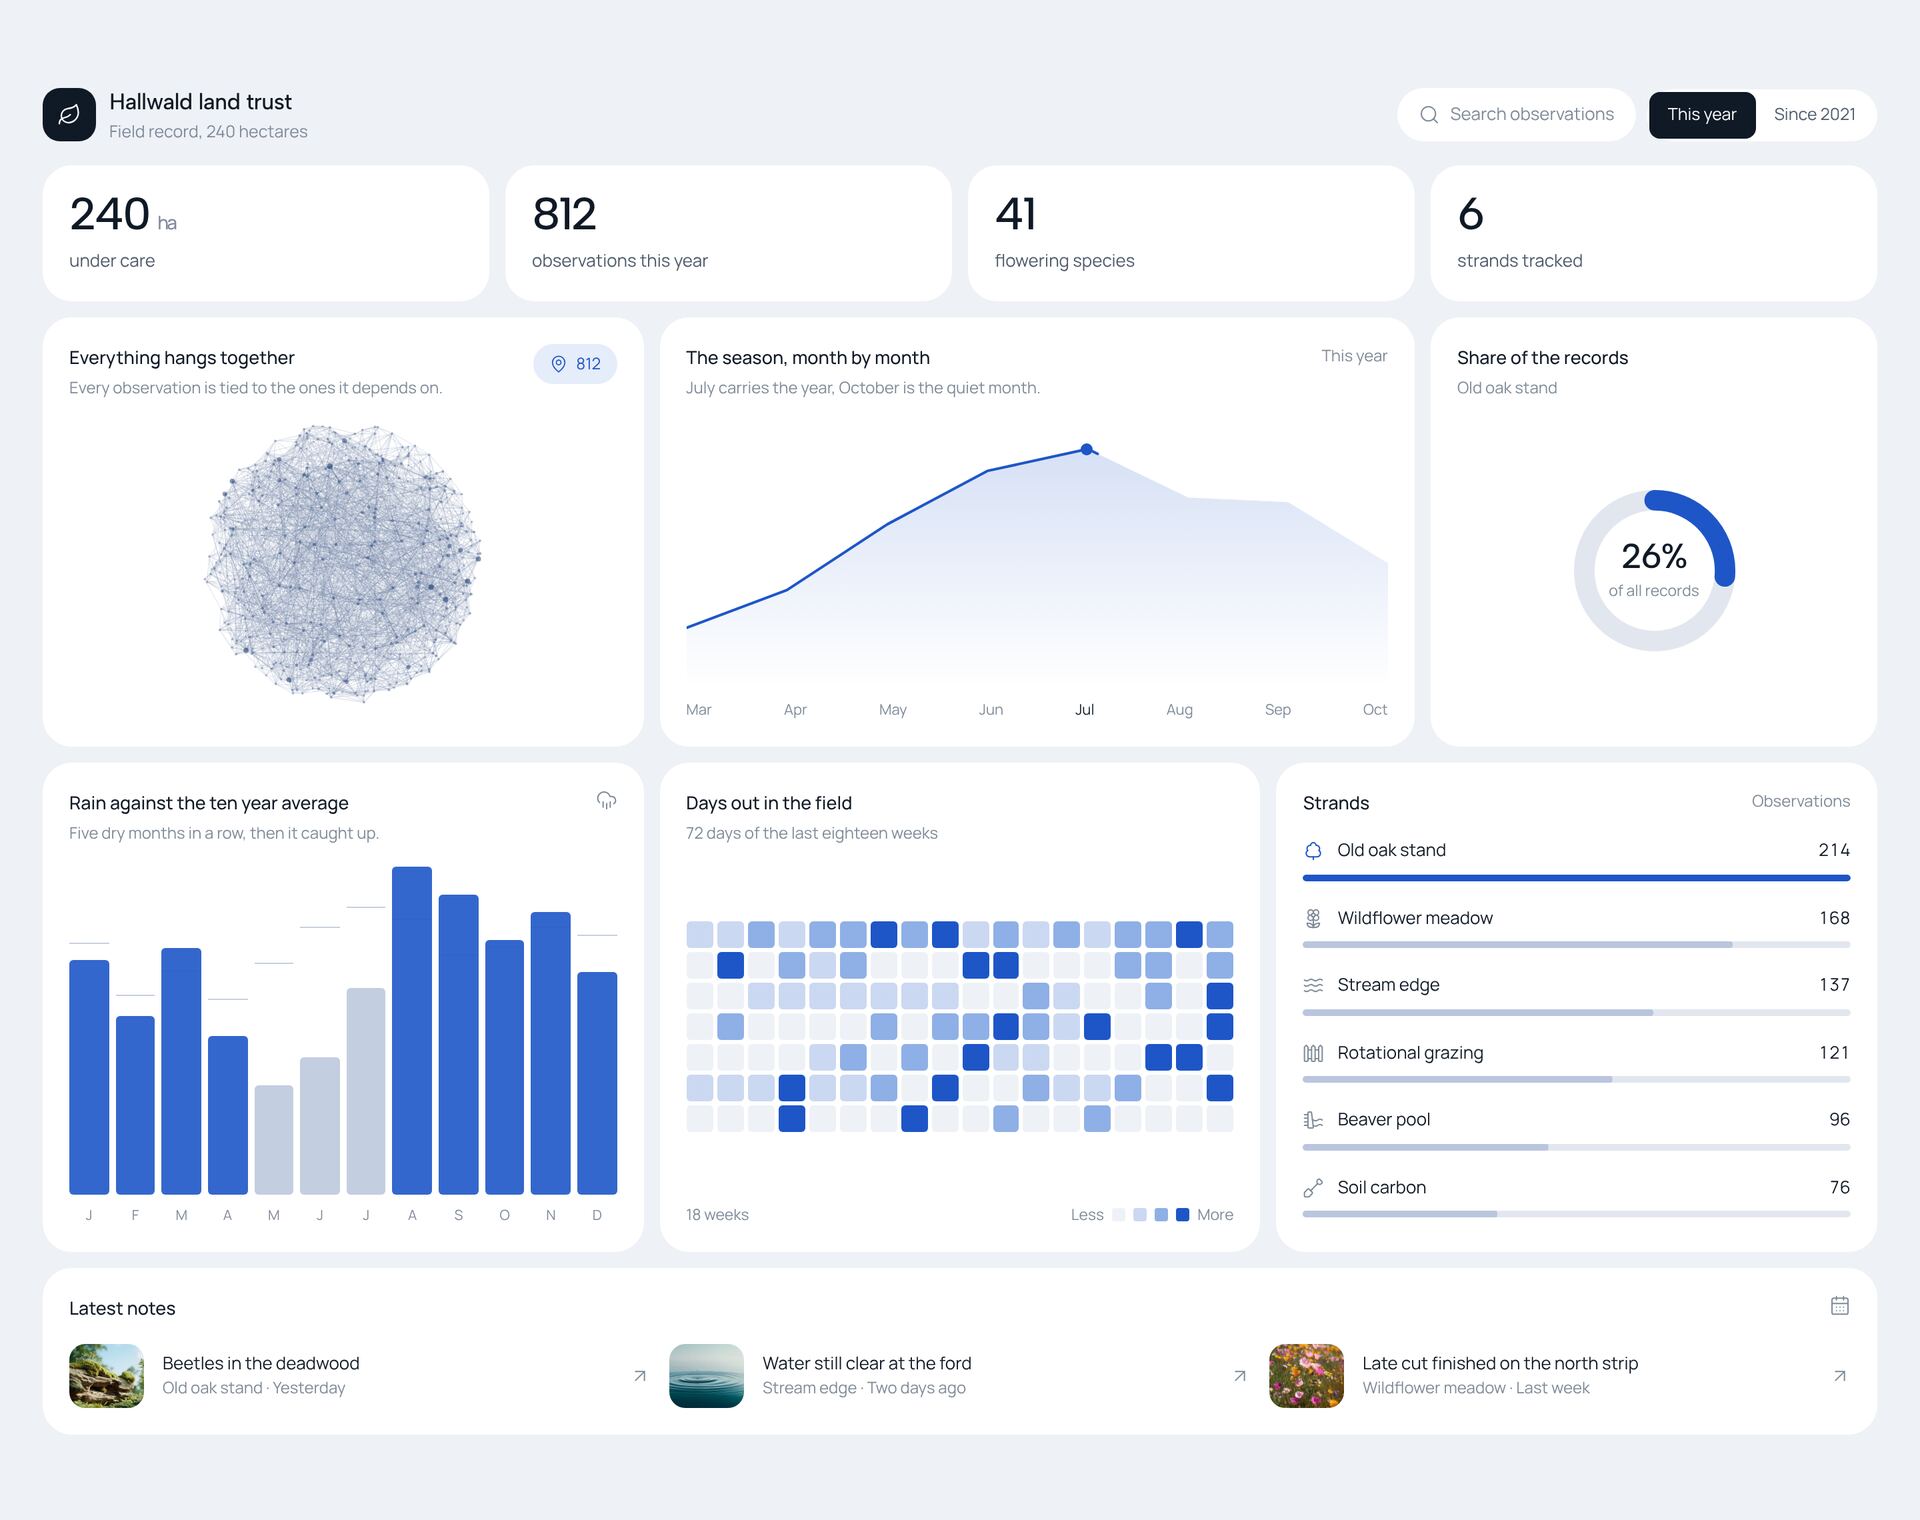
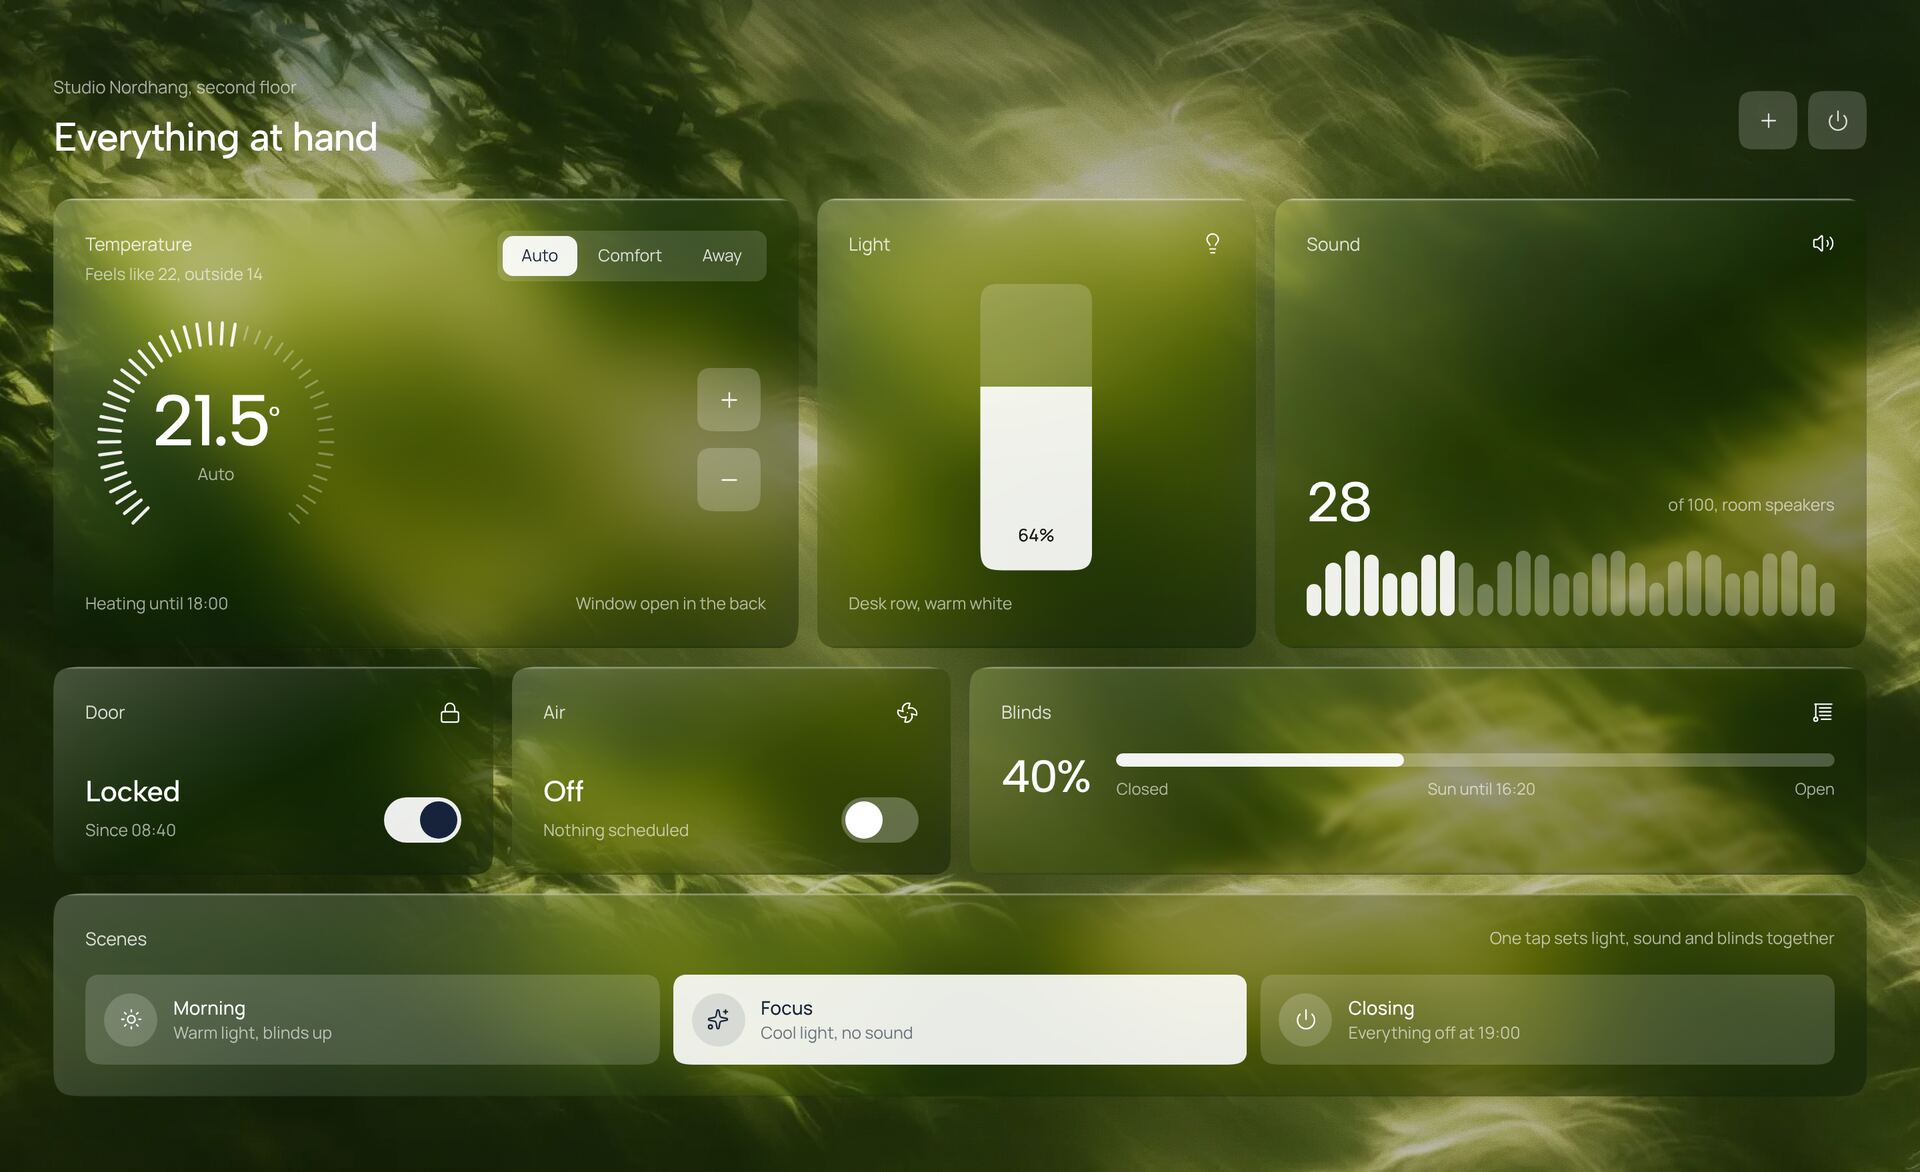
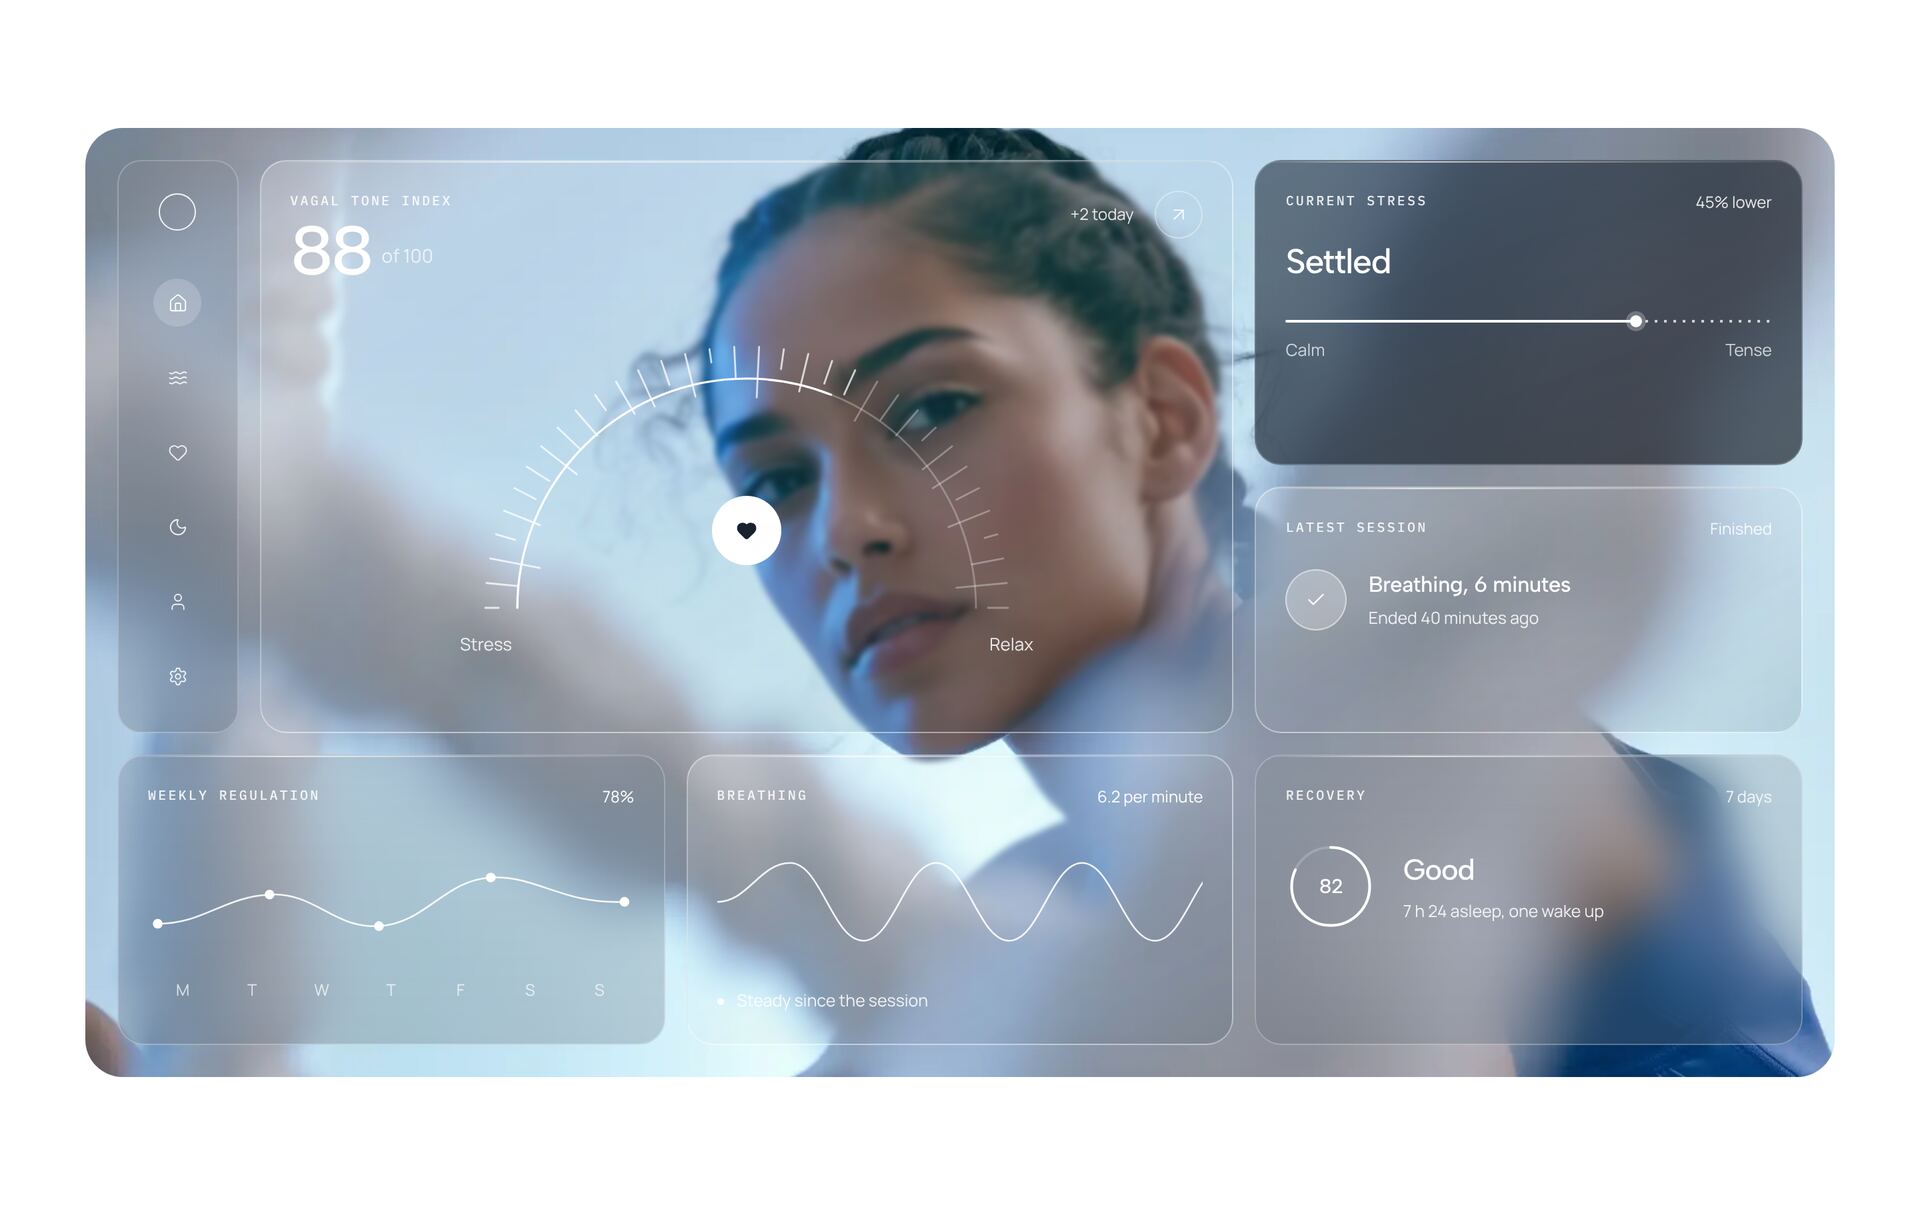
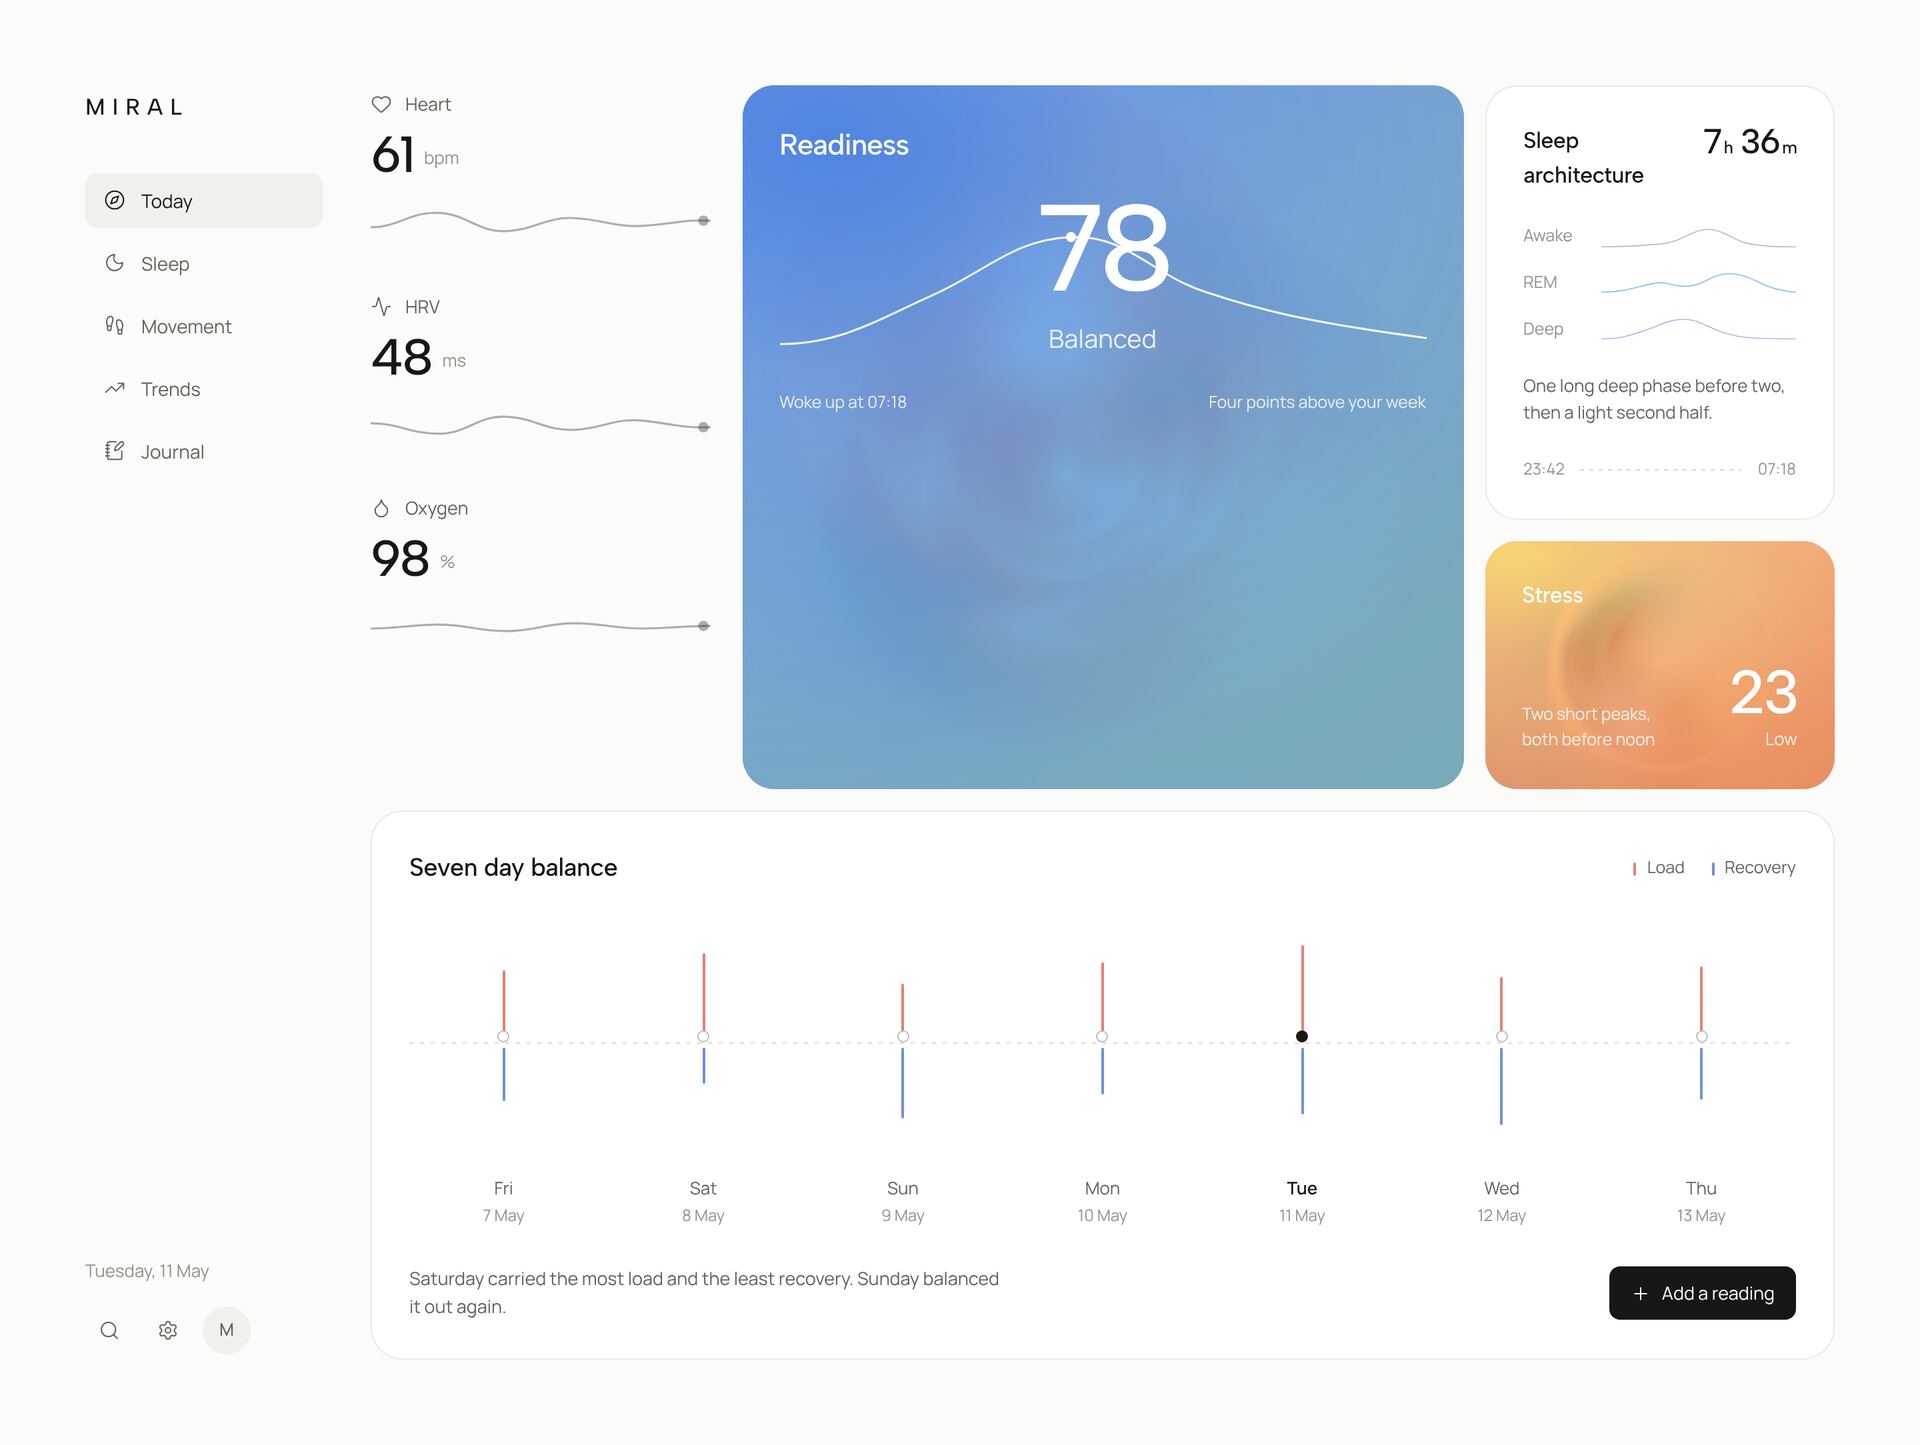
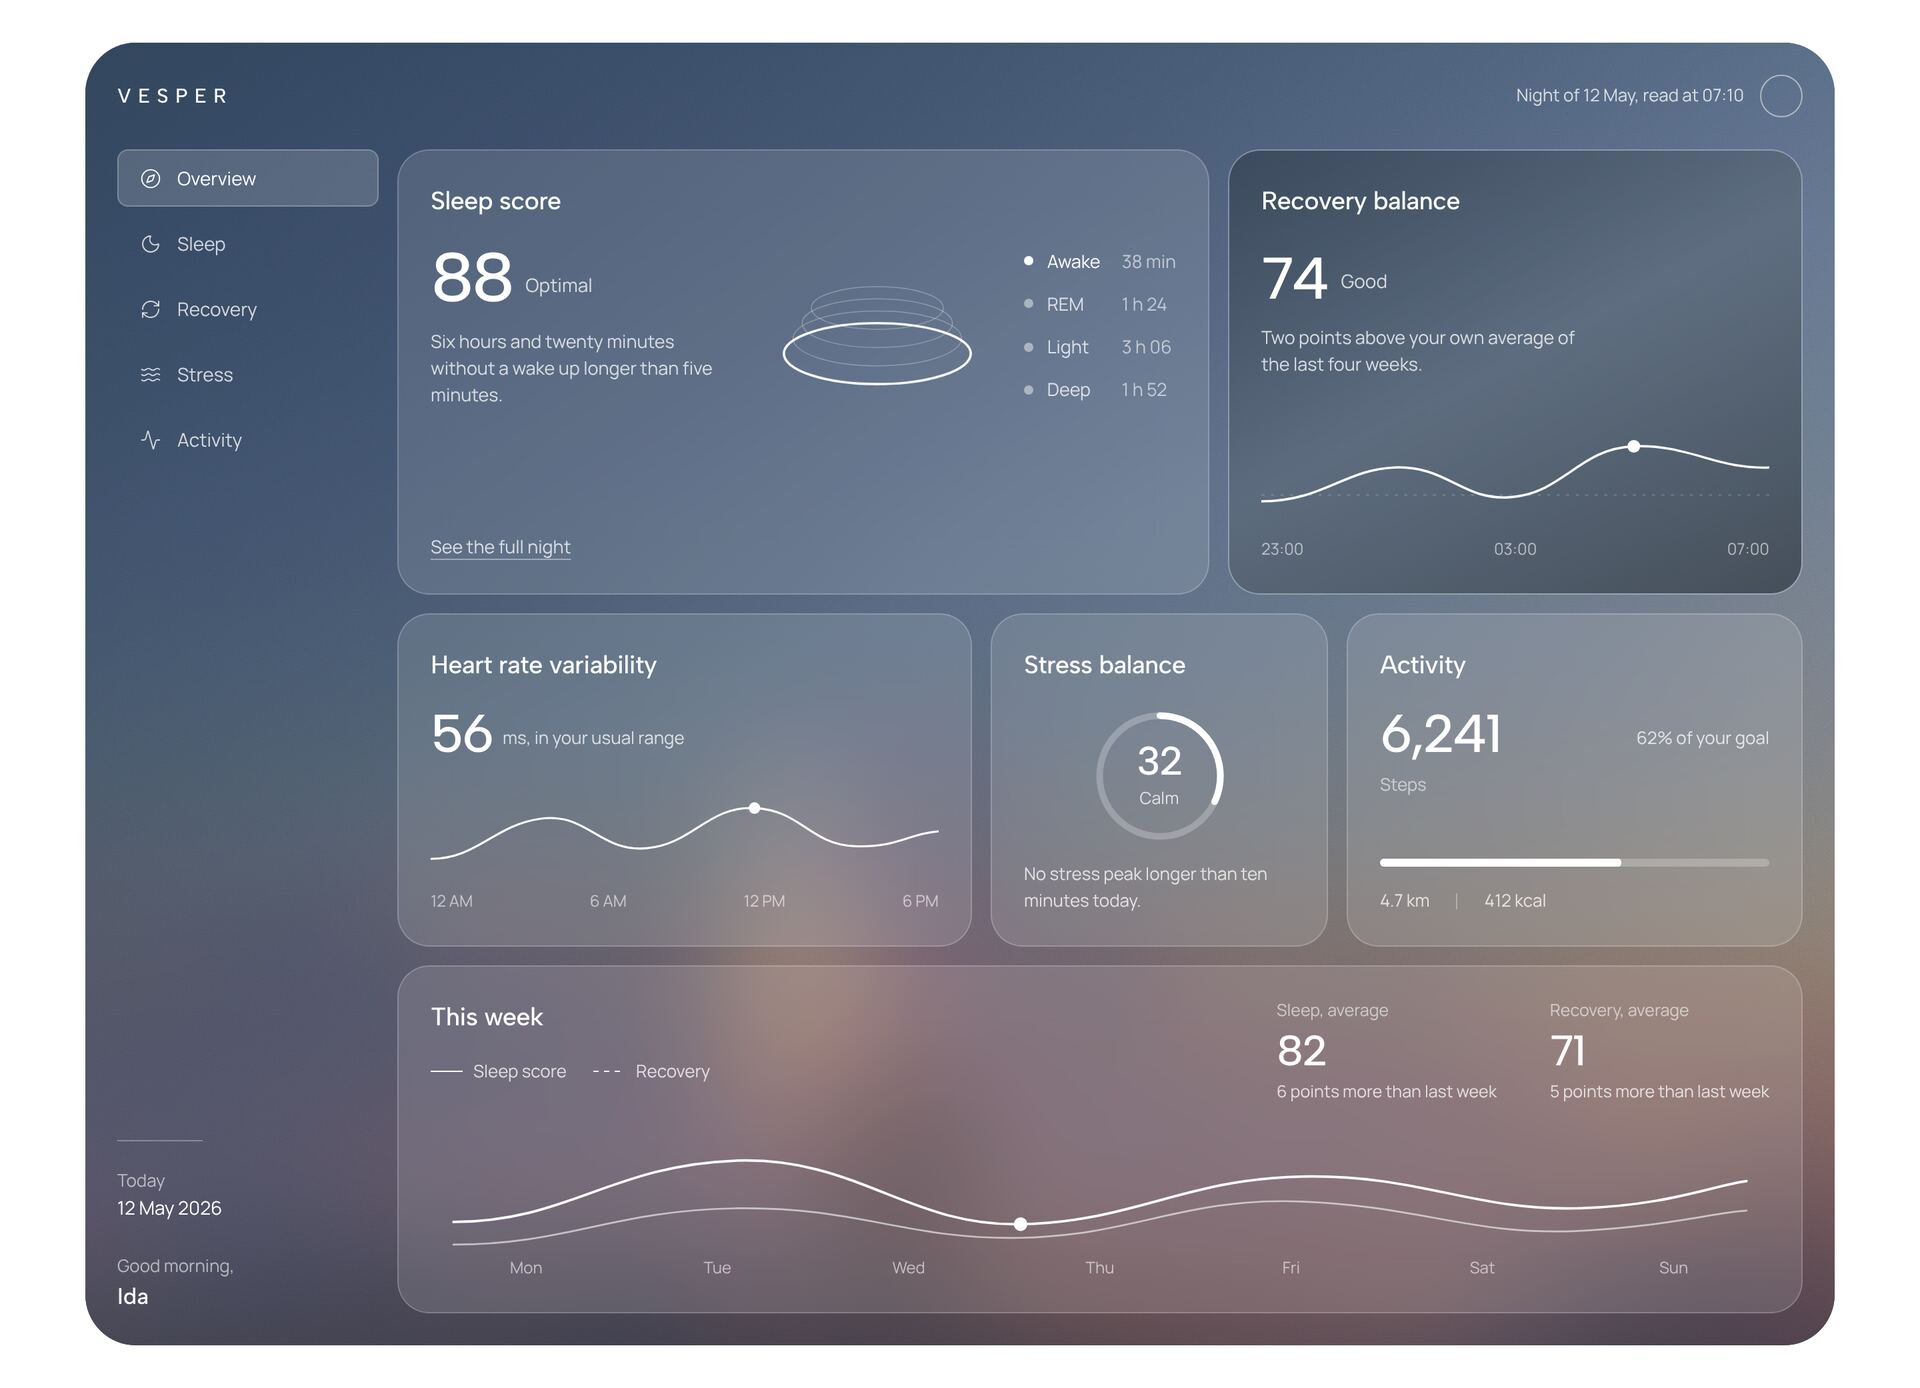
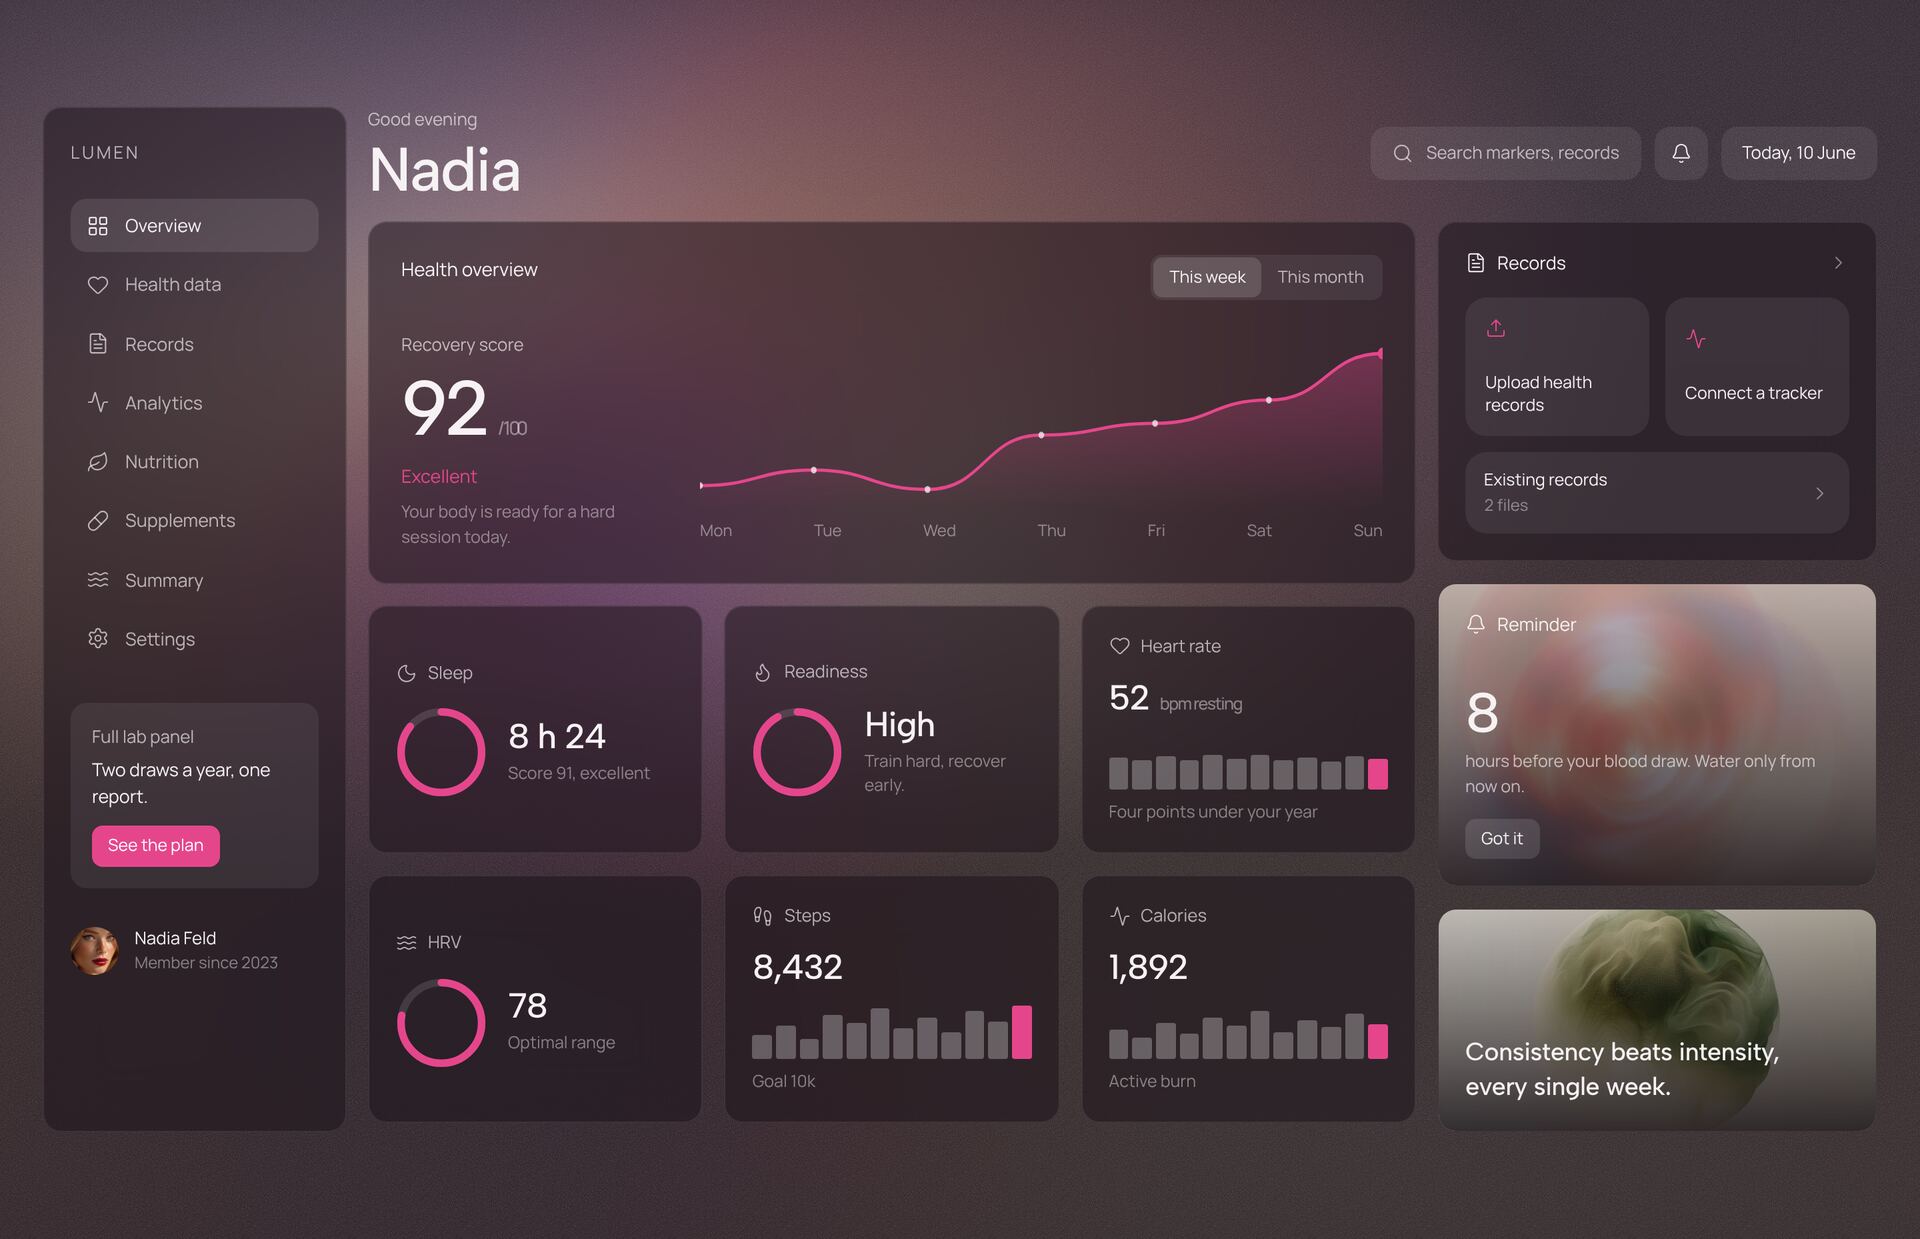
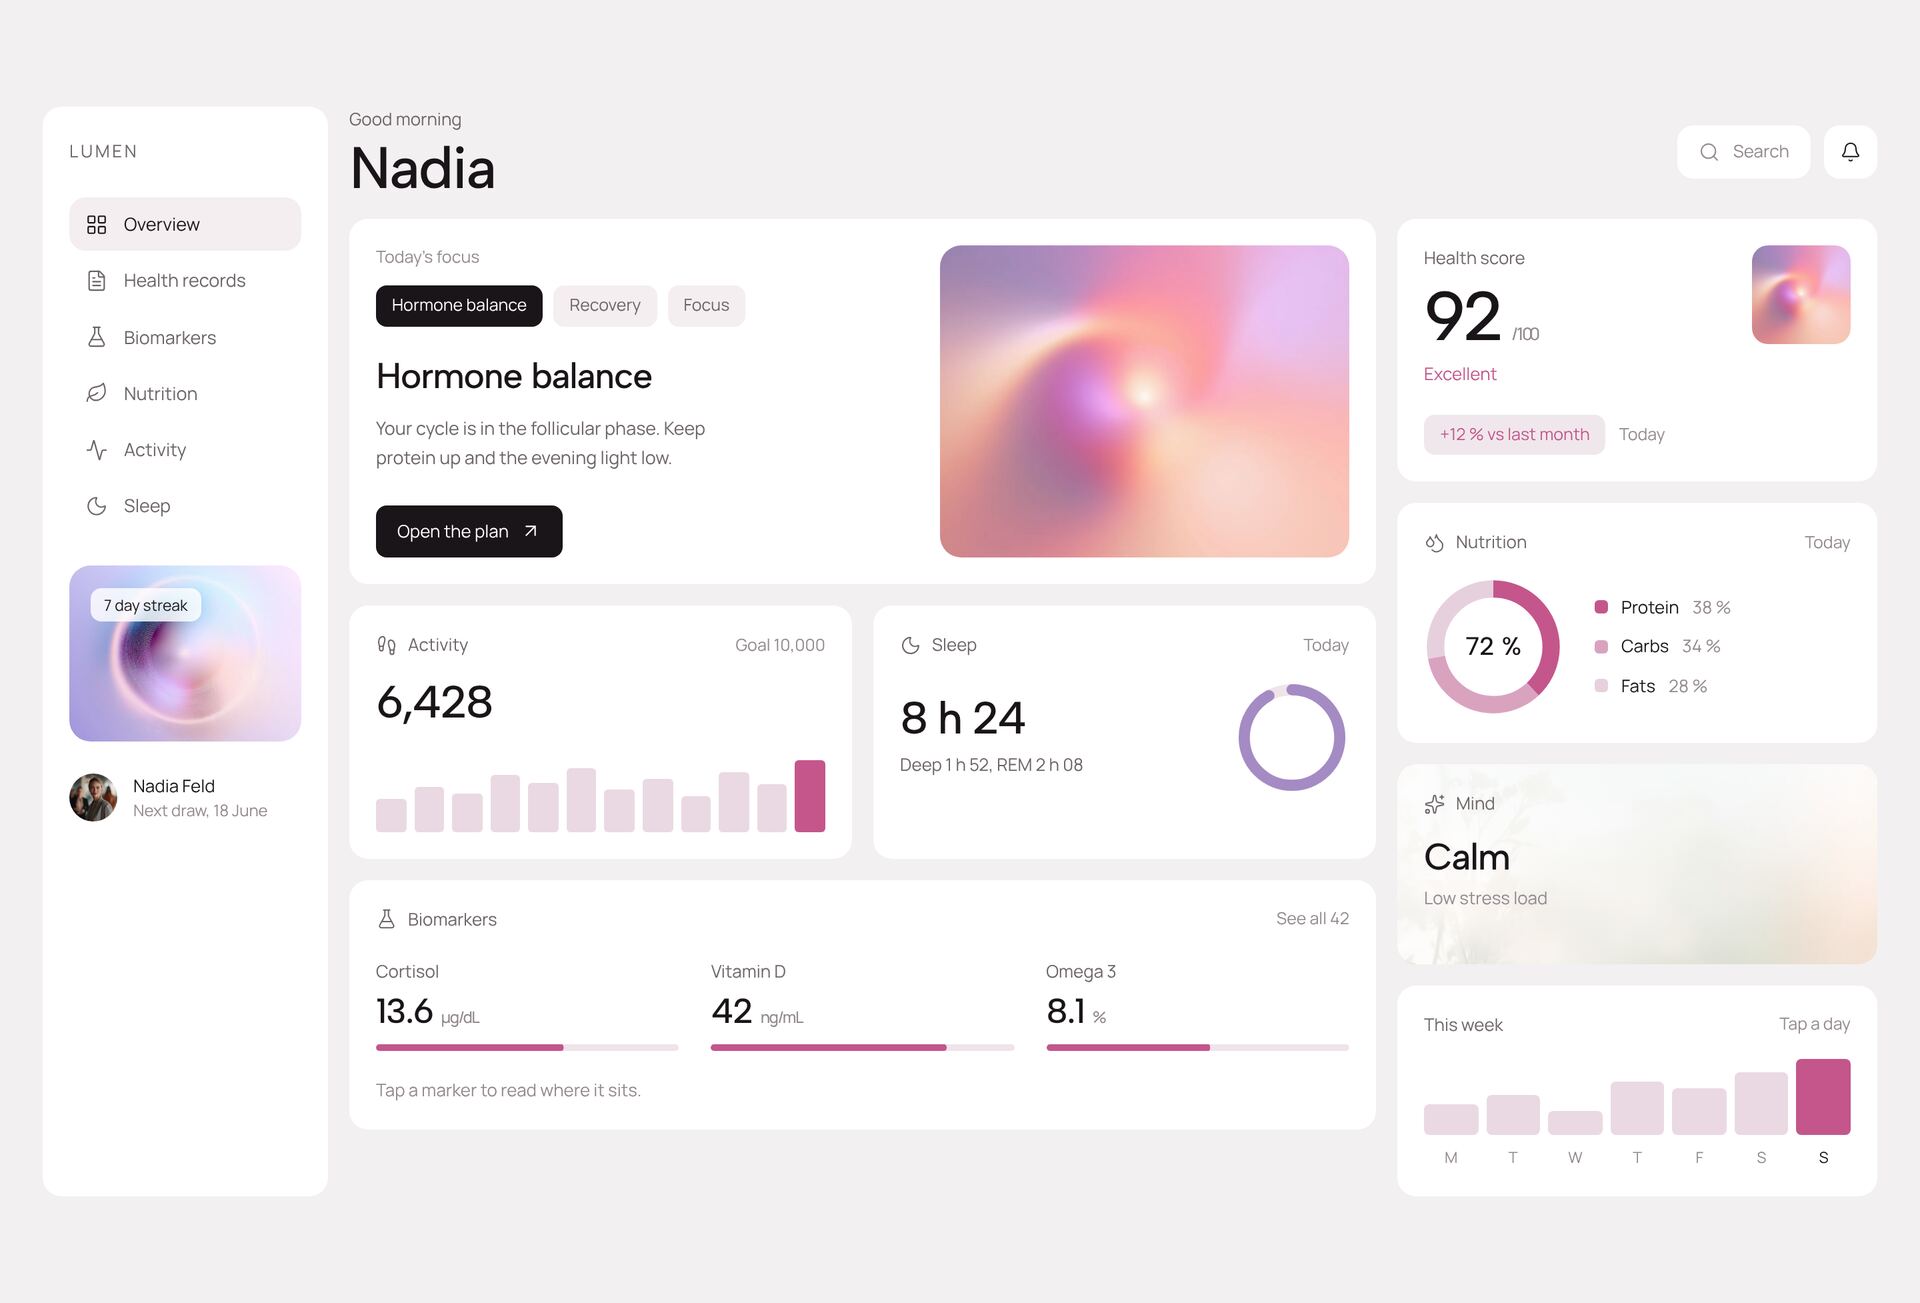
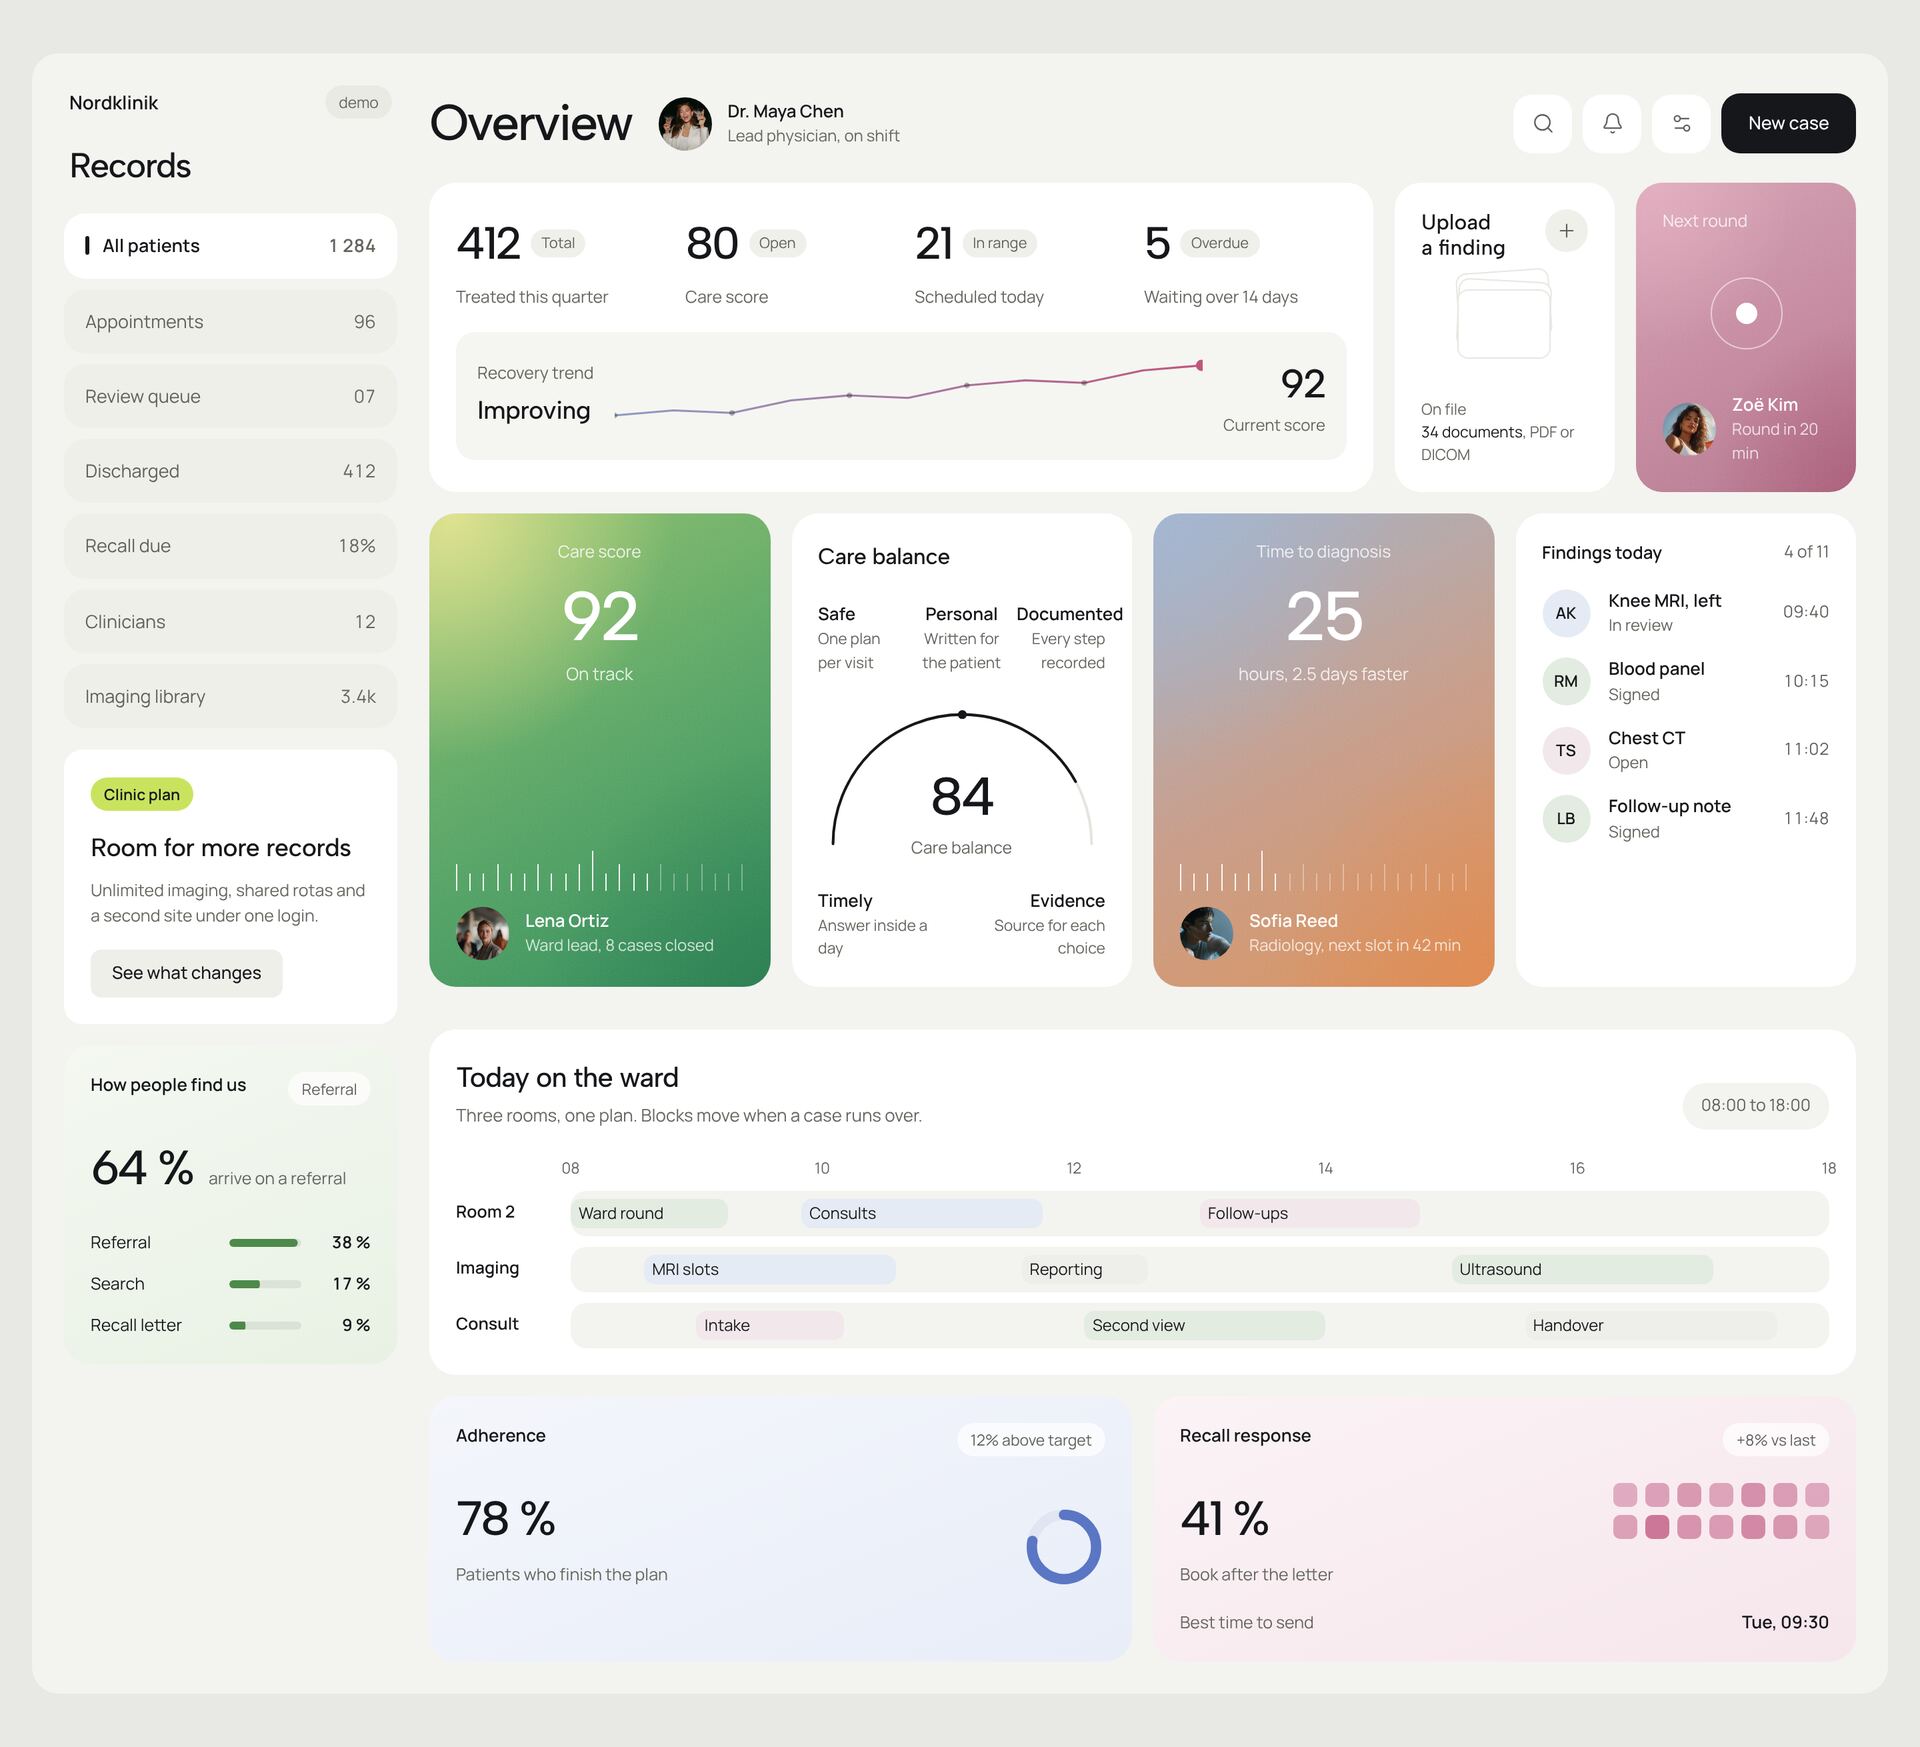
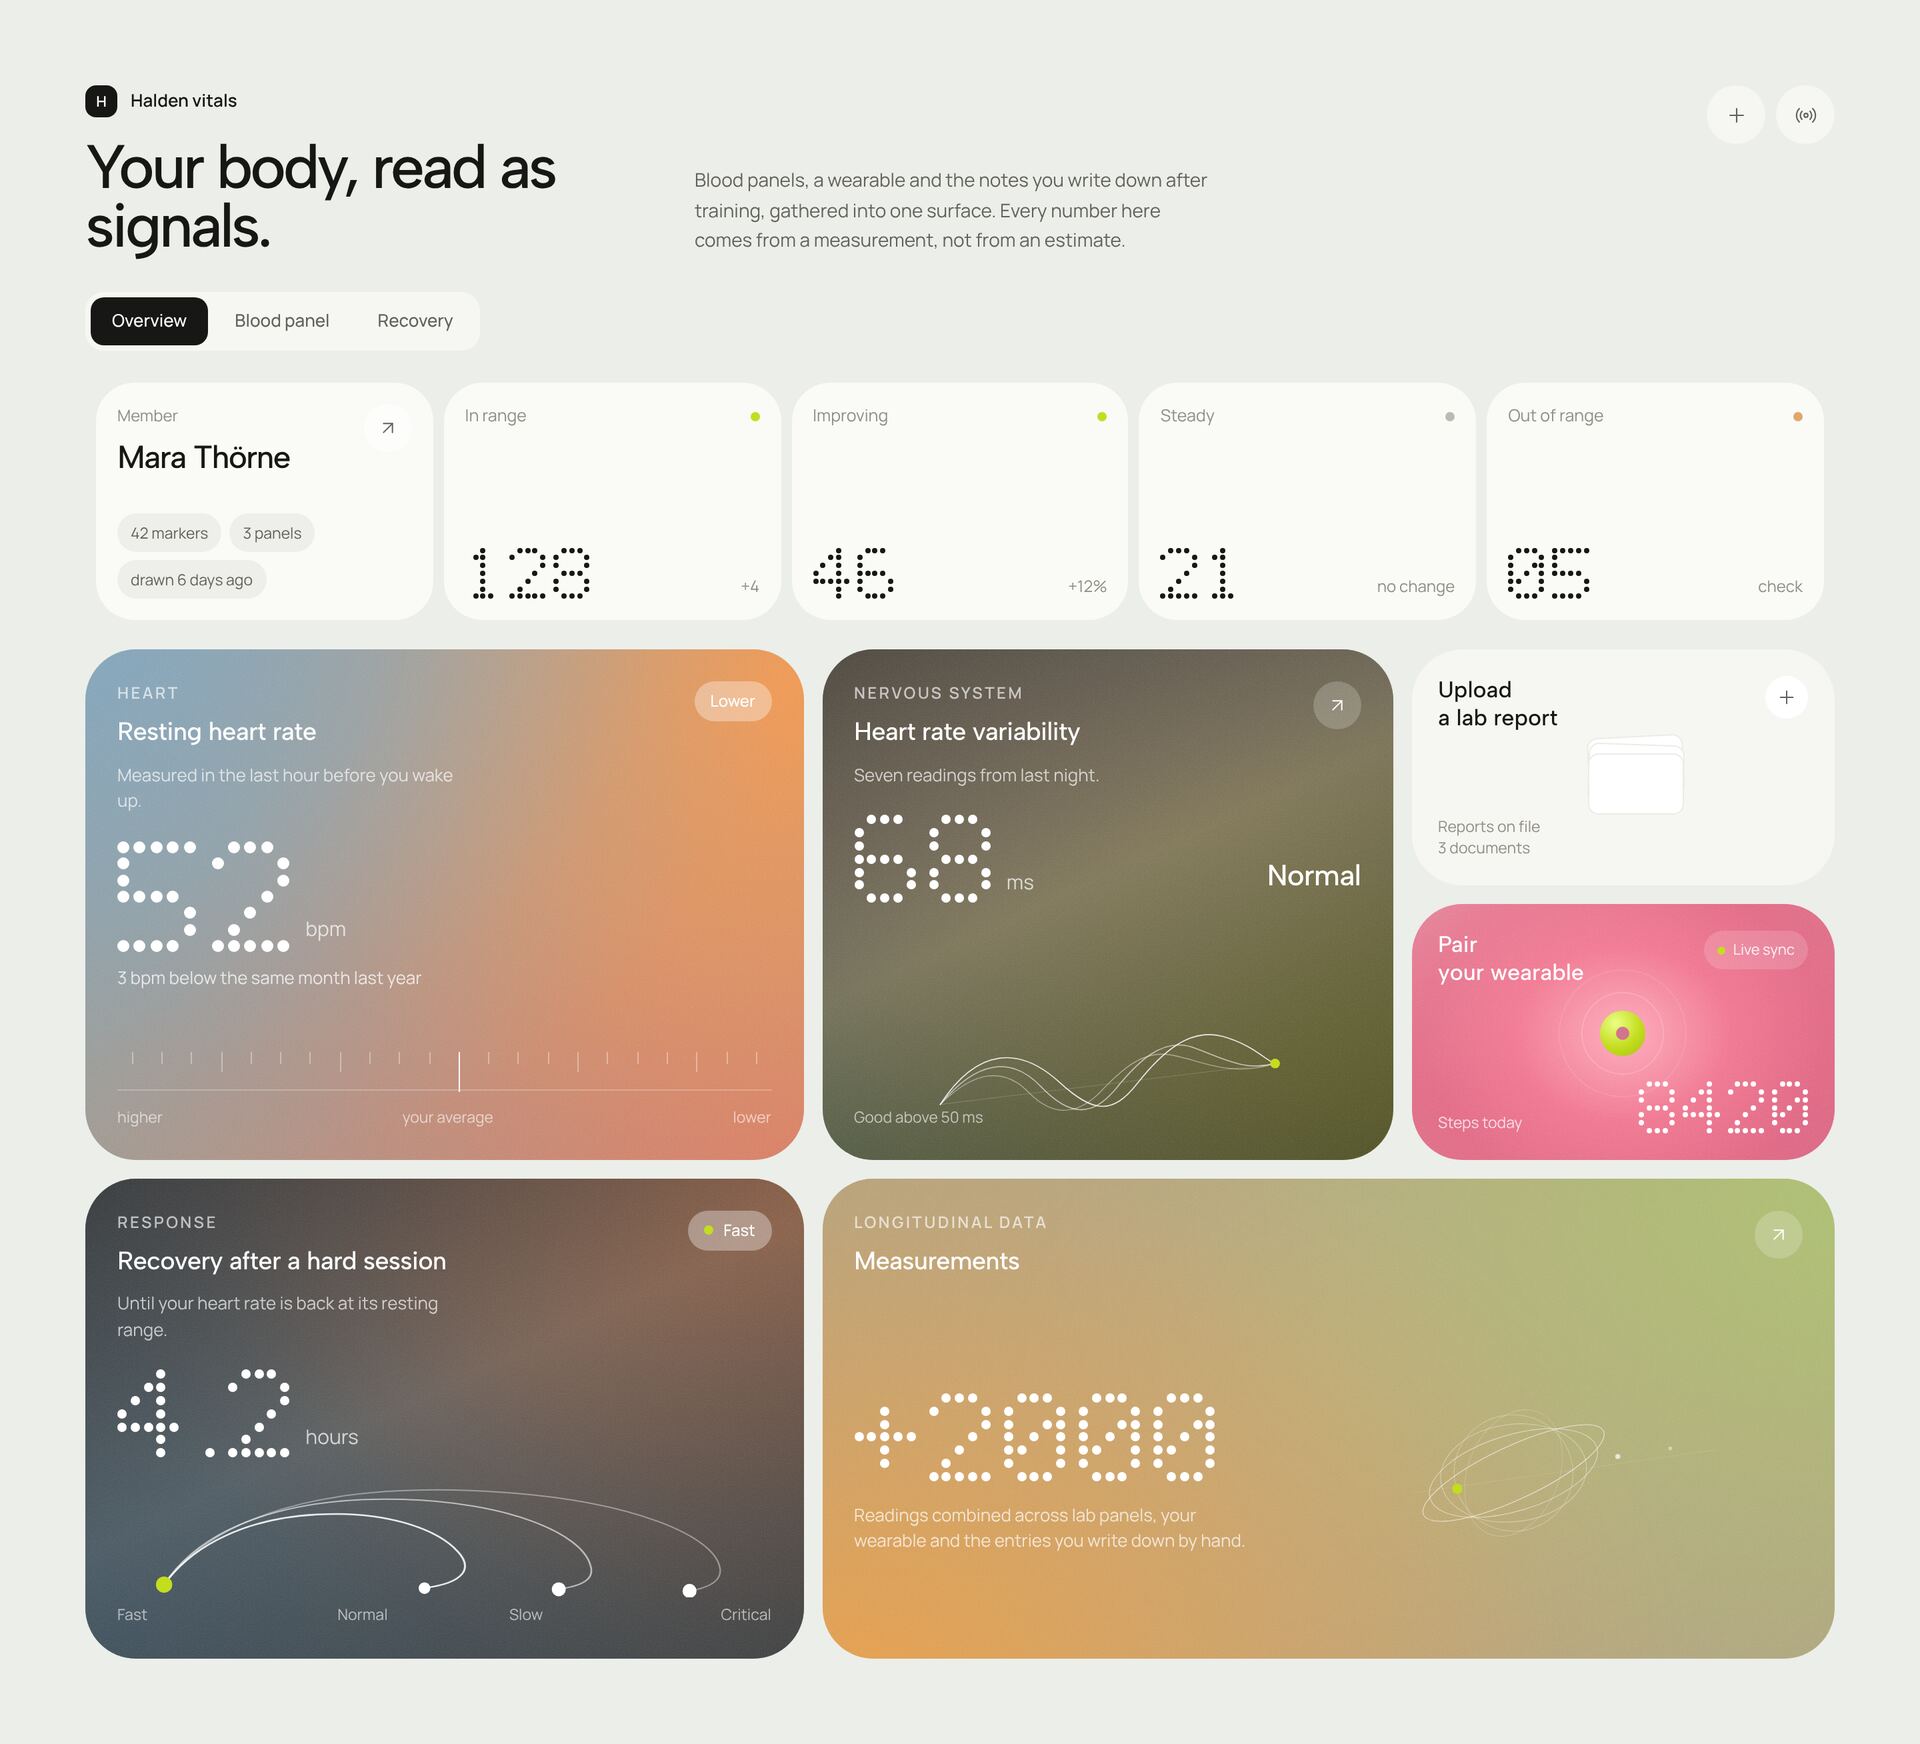
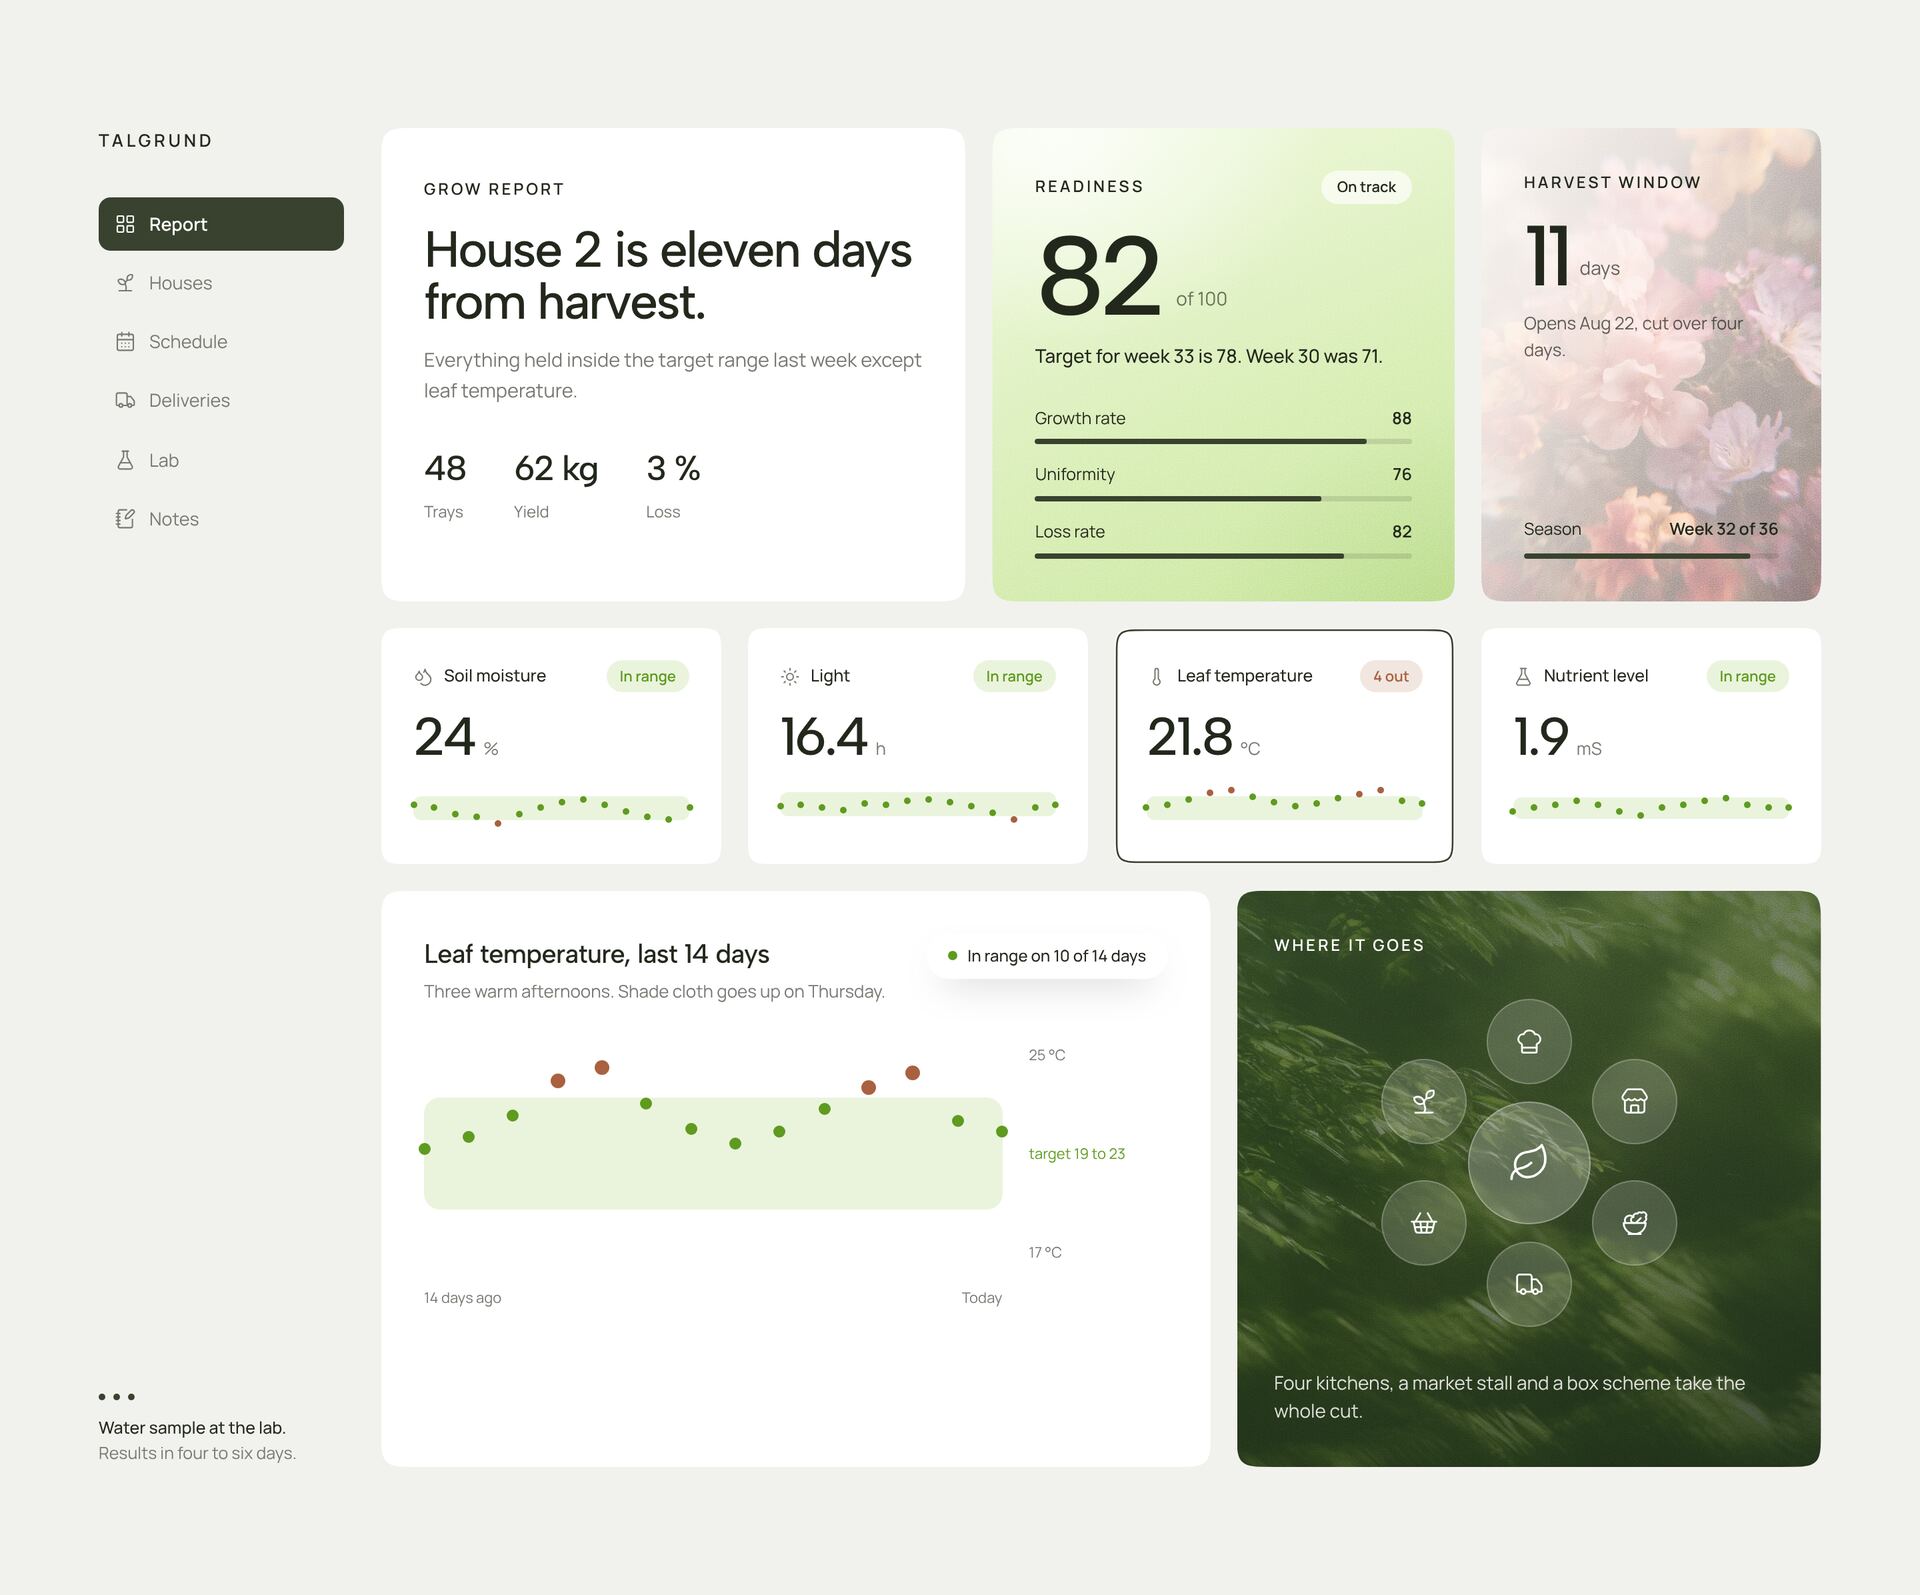
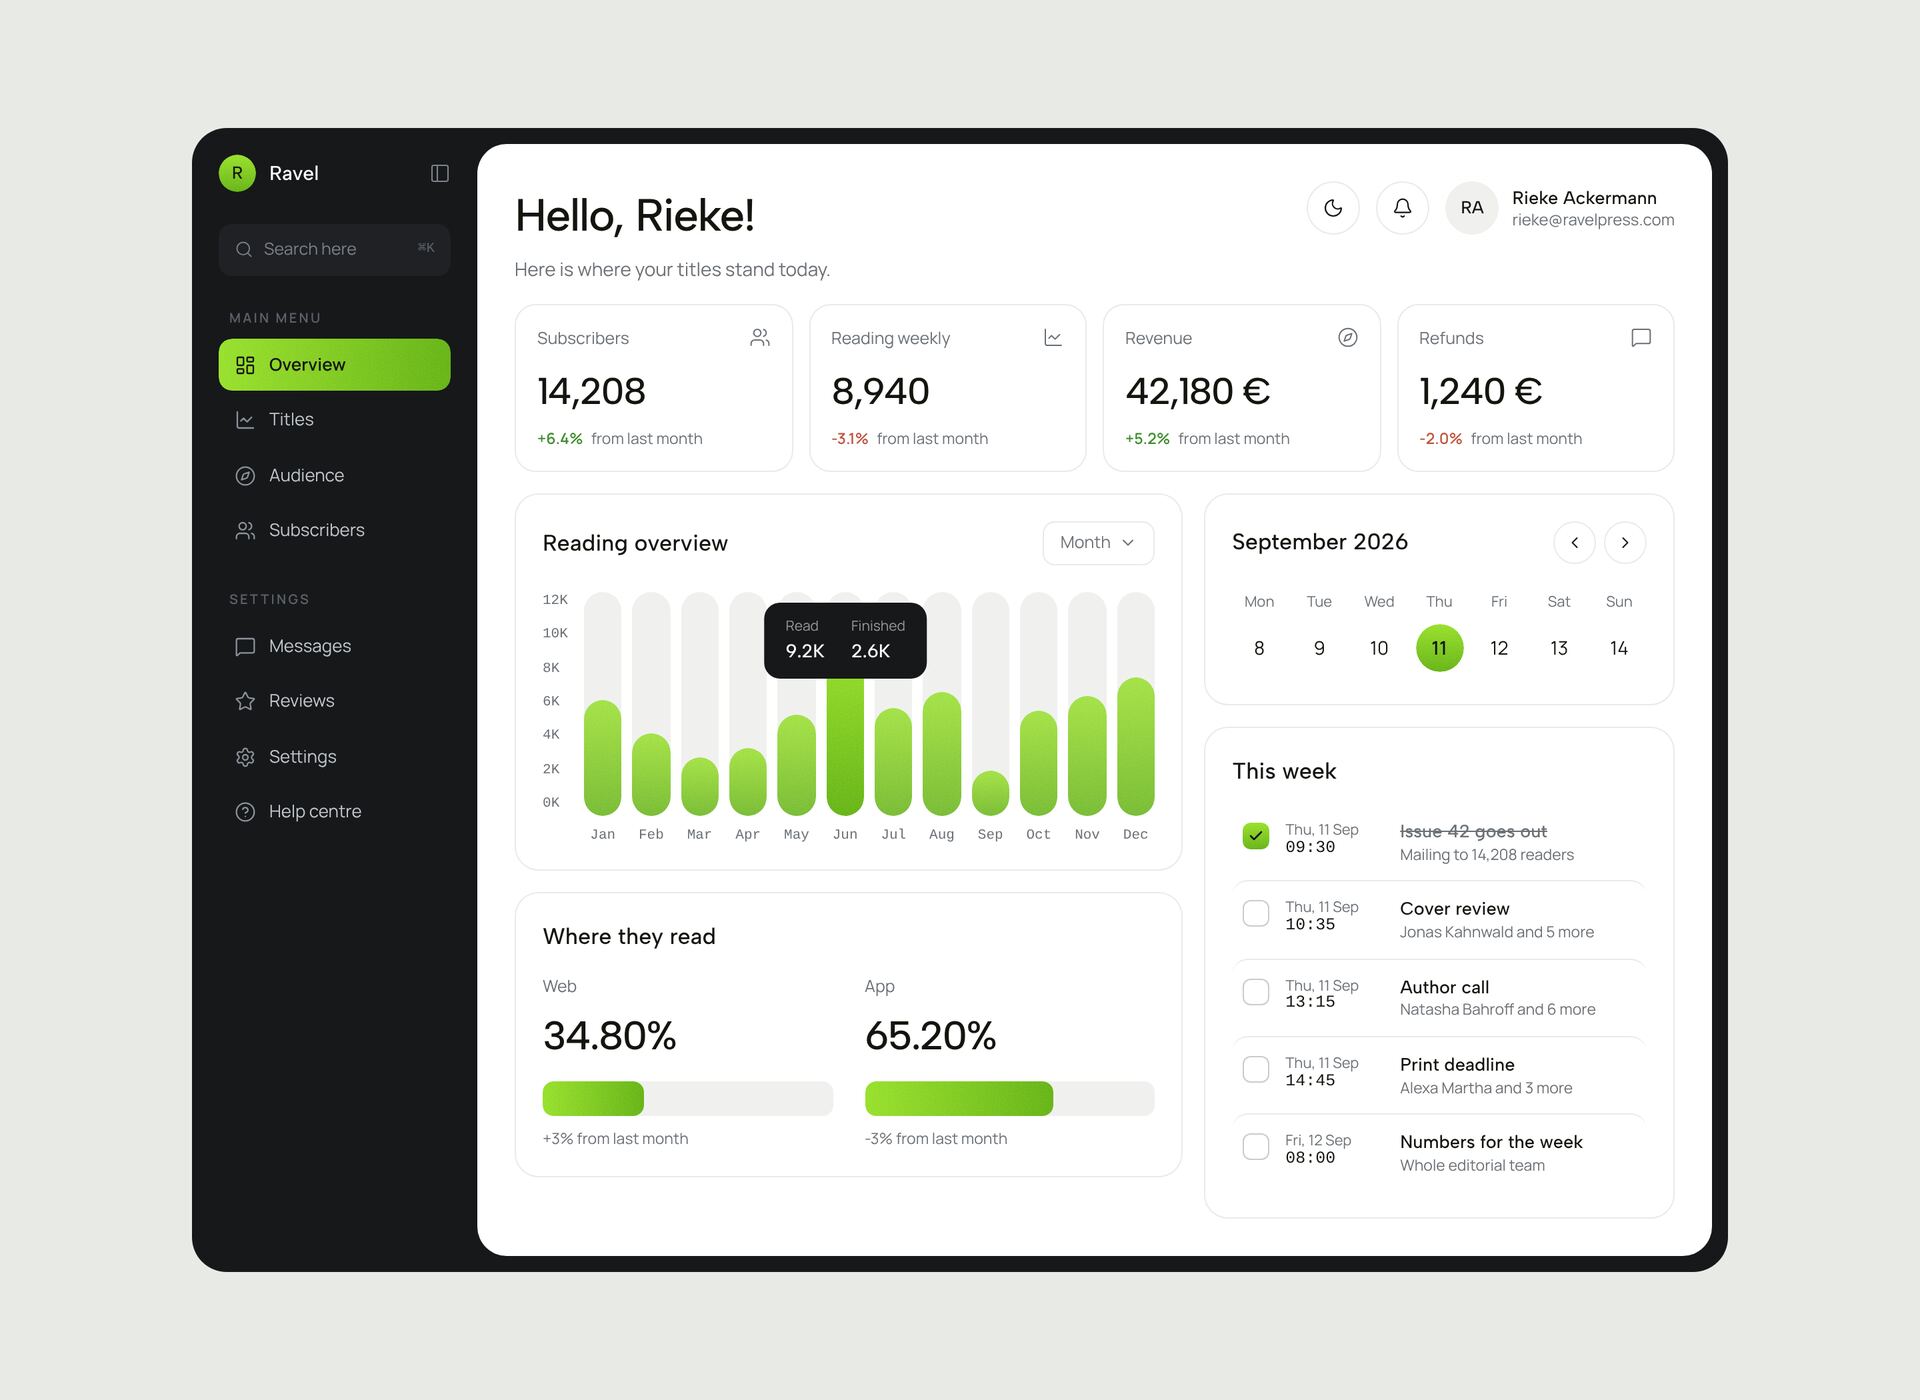
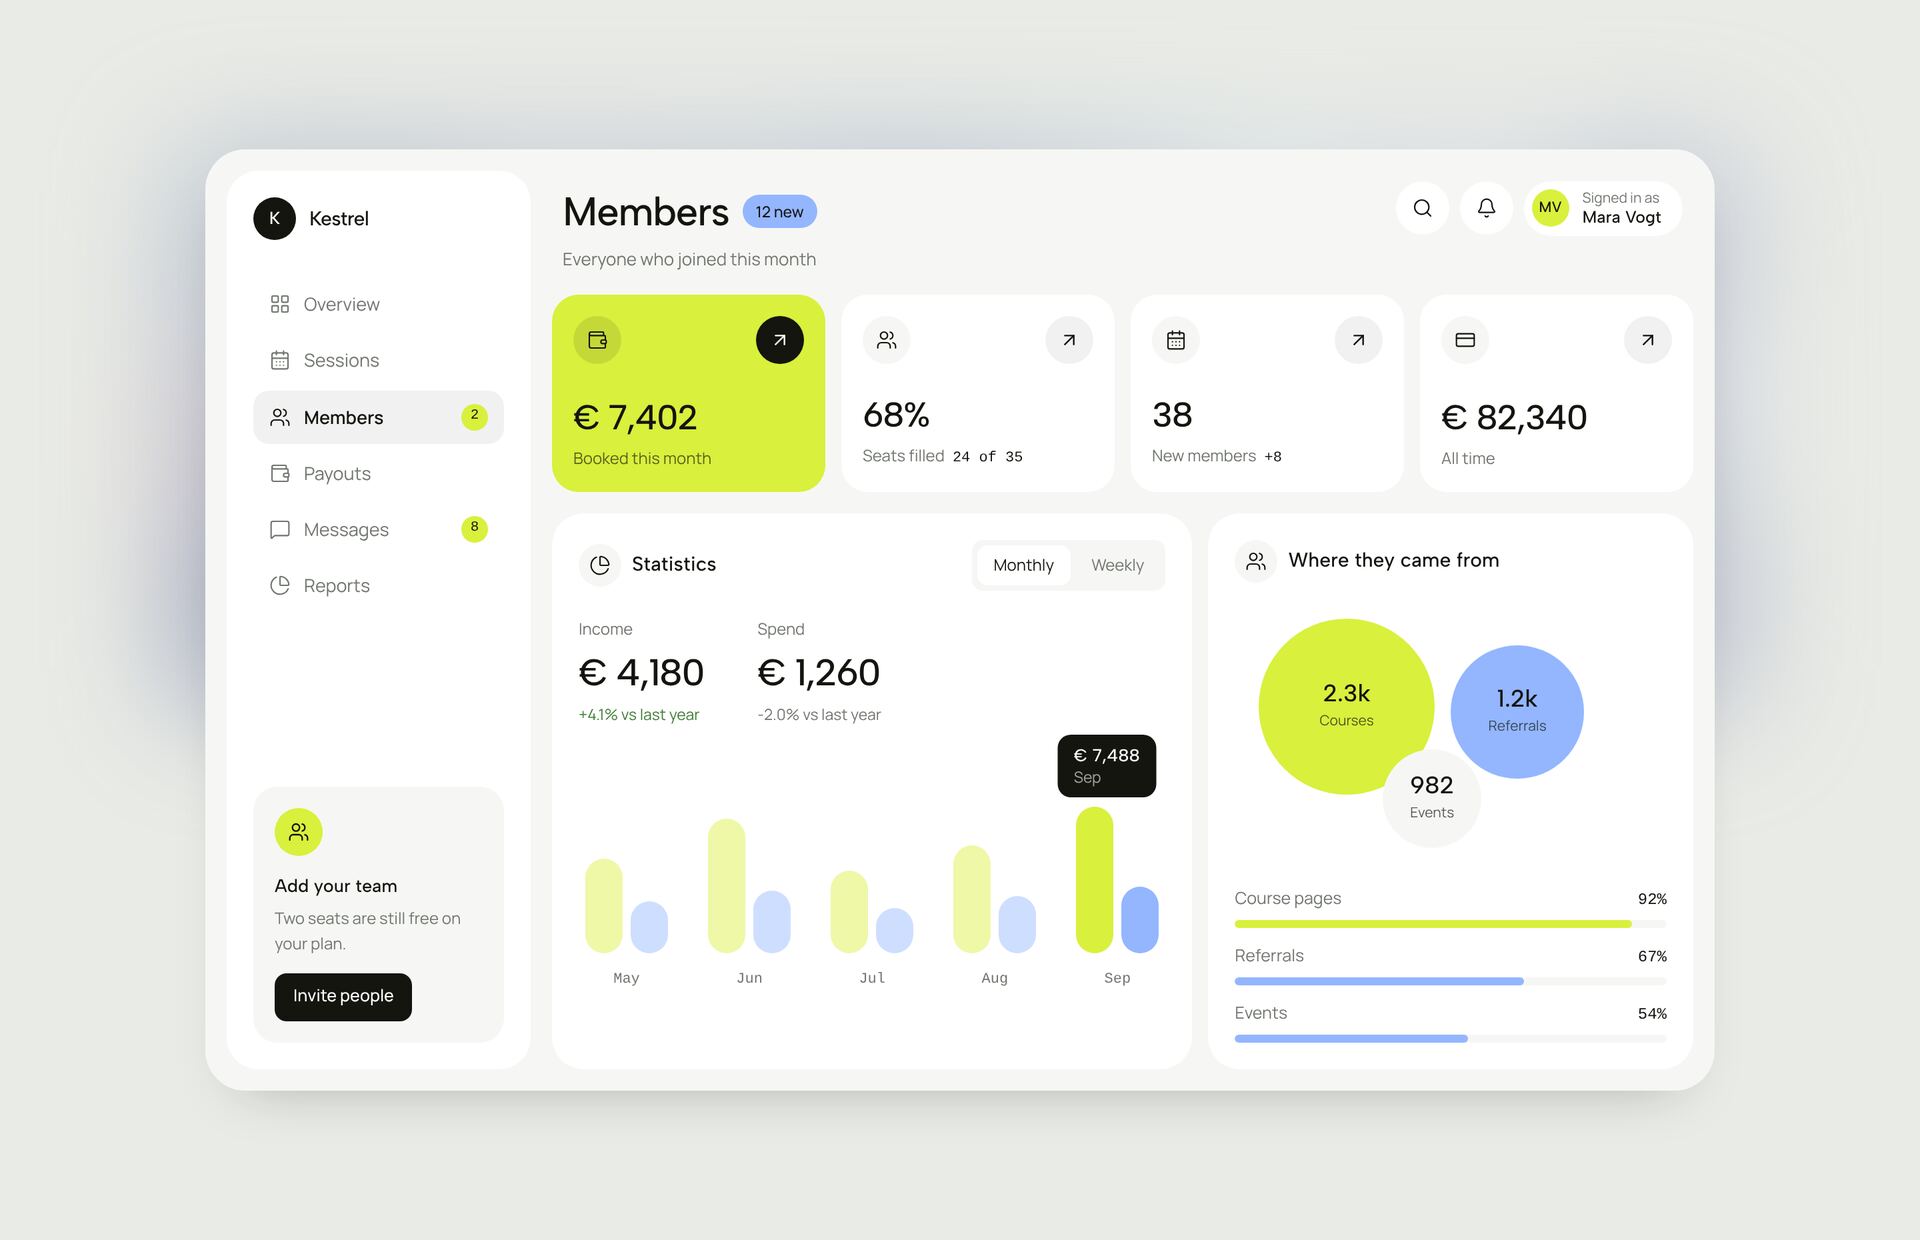
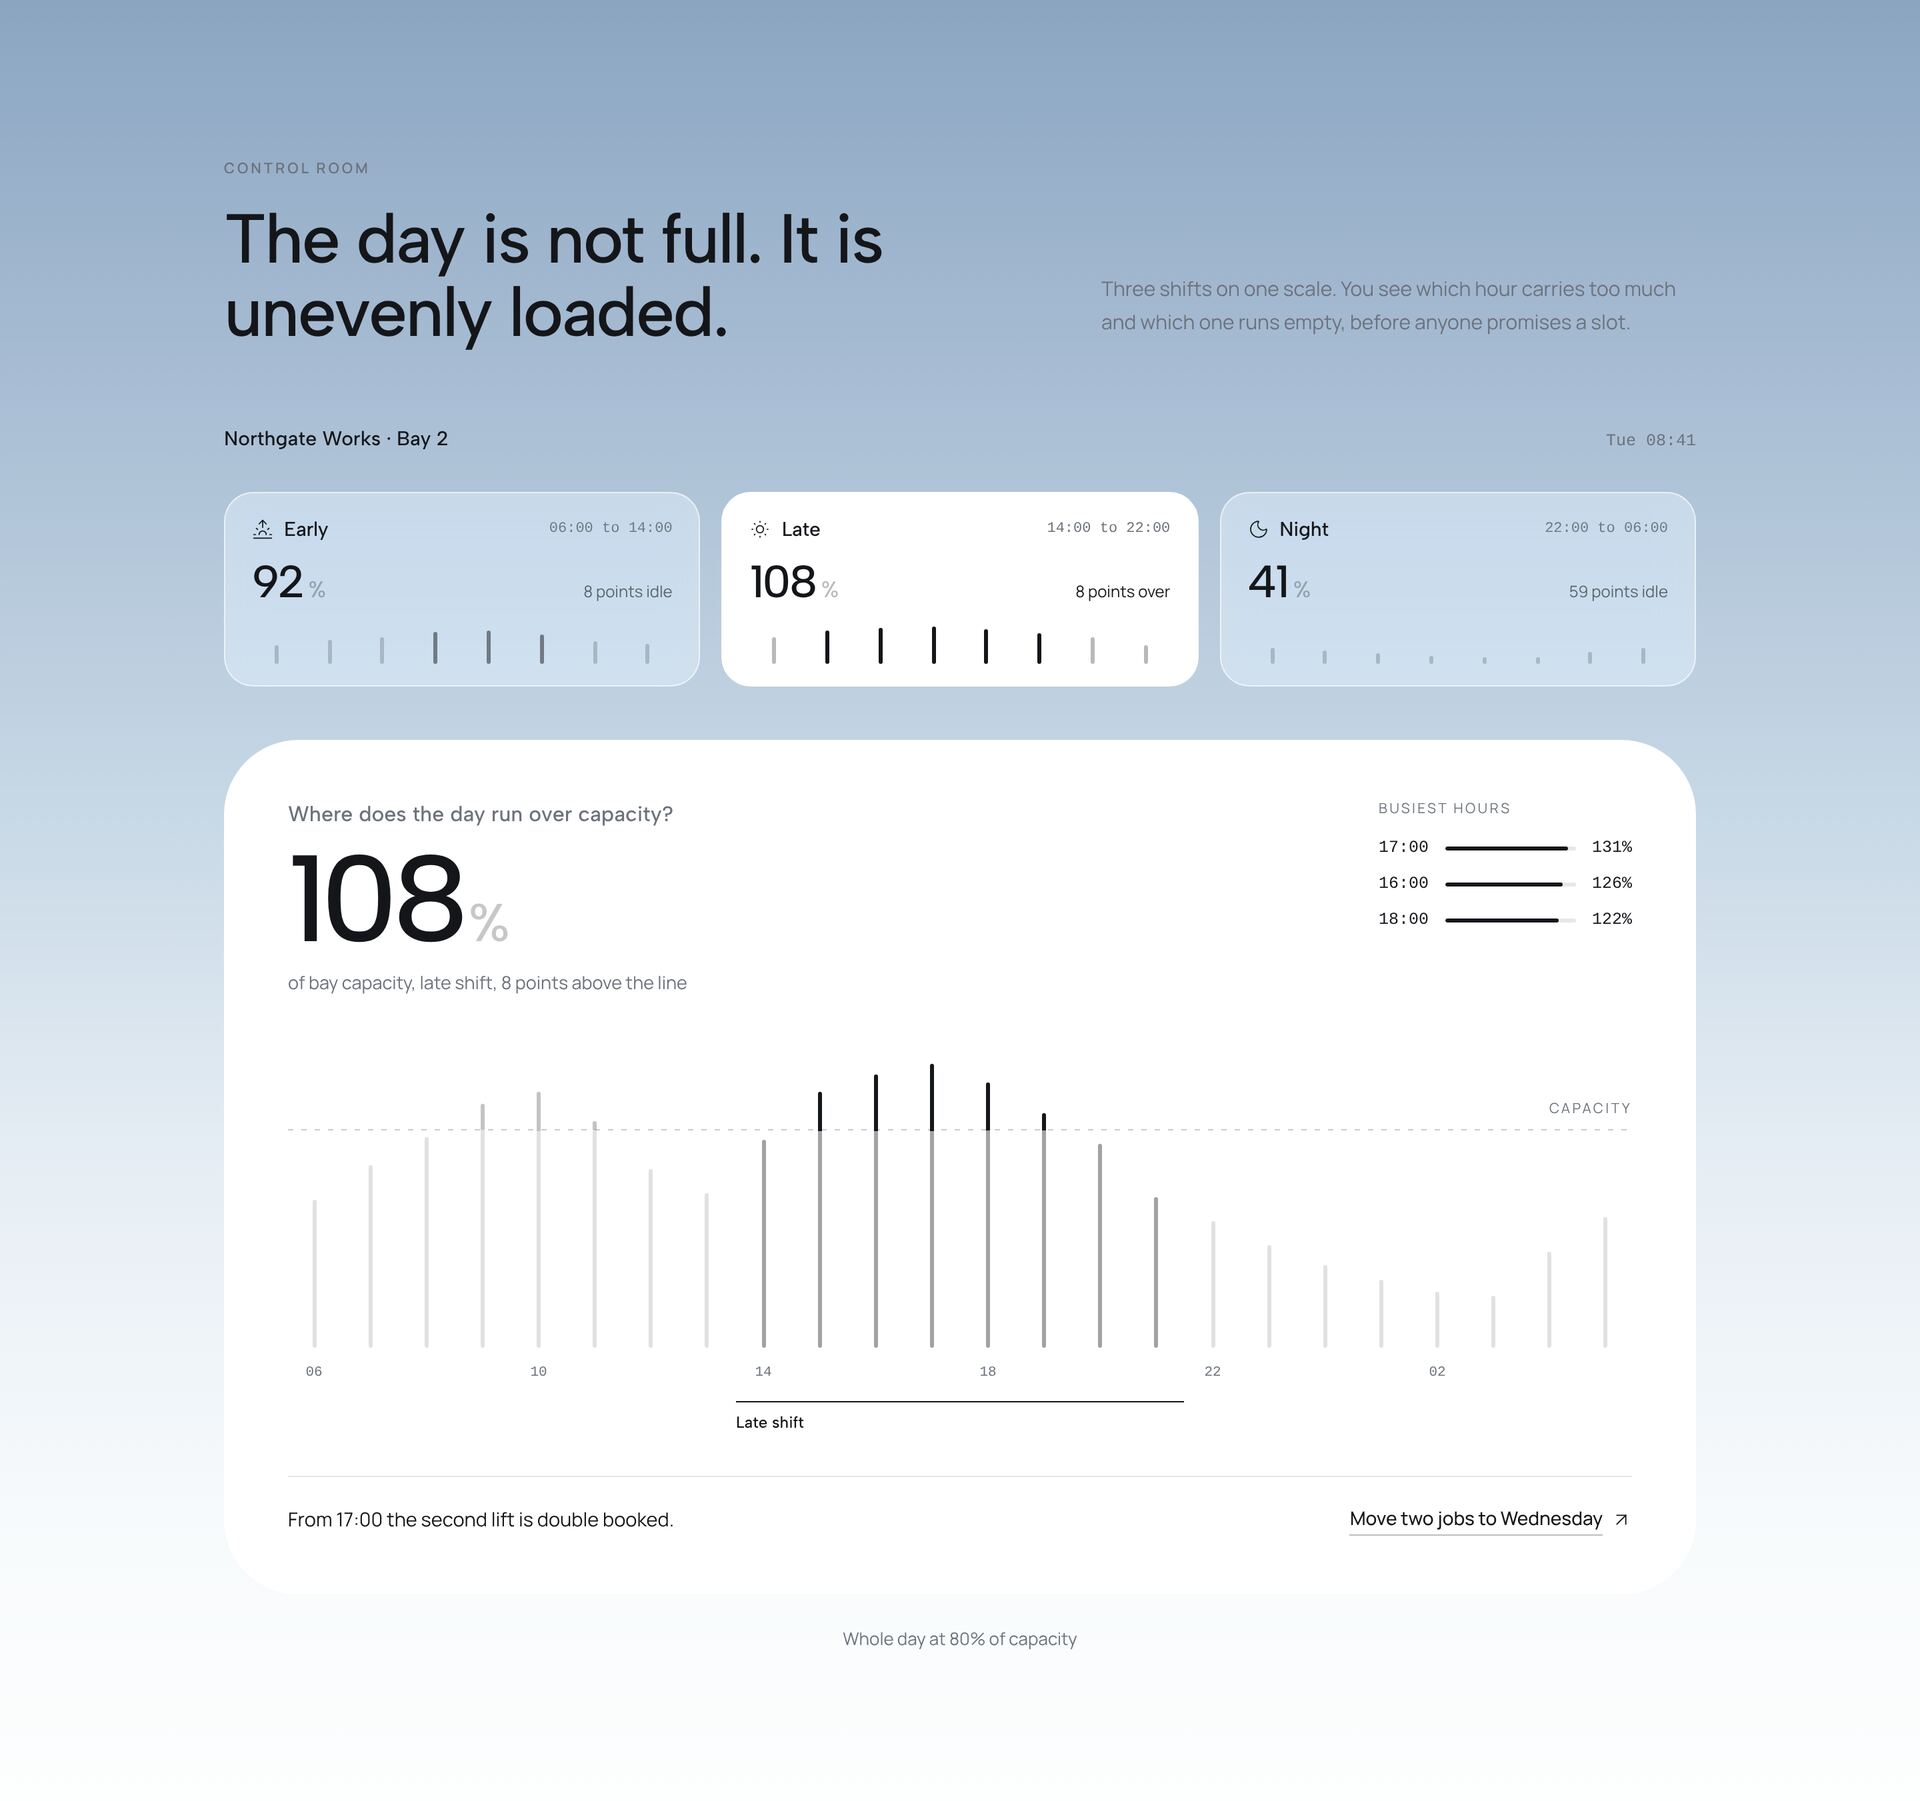
A dashboard section shows data the way a product does, either as a preview on a marketing page or as a starting point for a real interface. The dashboards here cover sleep and health data, bookings and stays, call insights, outreach batches, energy and habitat monitoring, care records and team capacity.
A good dashboard answers one question first. Put that answer in the largest number or chart and keep everything else smaller. Use one accent colour for the value that matters and neutral tones for the rest. Charts are drawn with SVG in React, so there is no chart library to install, and each dashboard is one file with Tailwind classes and sample data you replace with your own.
More section categories
Frequently asked questions
Yes. The sample data sits in plain arrays and objects in the file. Replace it with data from your API or state, and the charts redraw from it.
No. Charts are drawn with SVG in React. The only dependencies are react, framer-motion and lucide-react.
Panels stack into one column and wide charts keep their proportions. On a phone, show the main number first and the details below.
Didn't find your question? We're happy to help.
Get in touch