





How do you show numbers on a website?
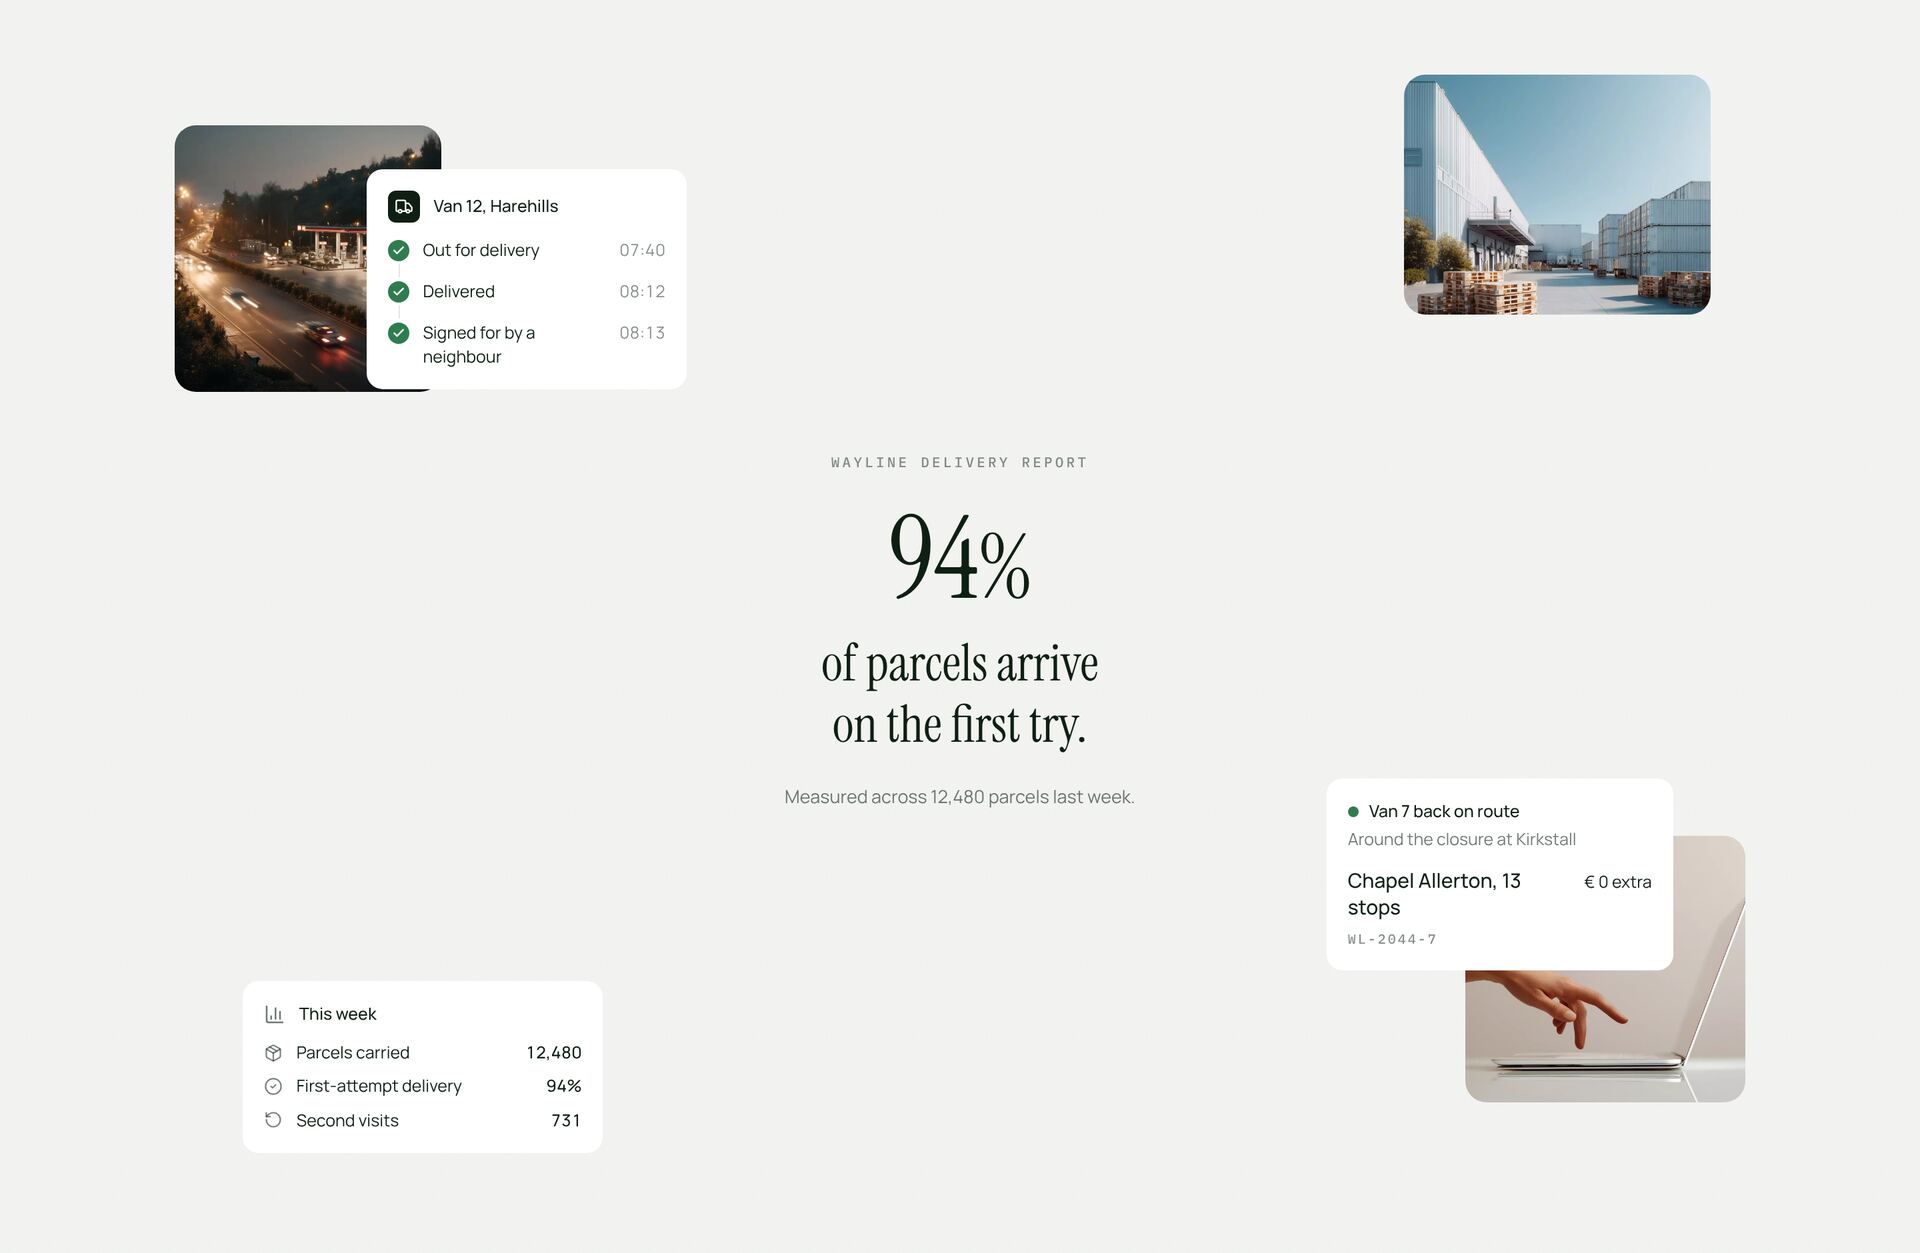
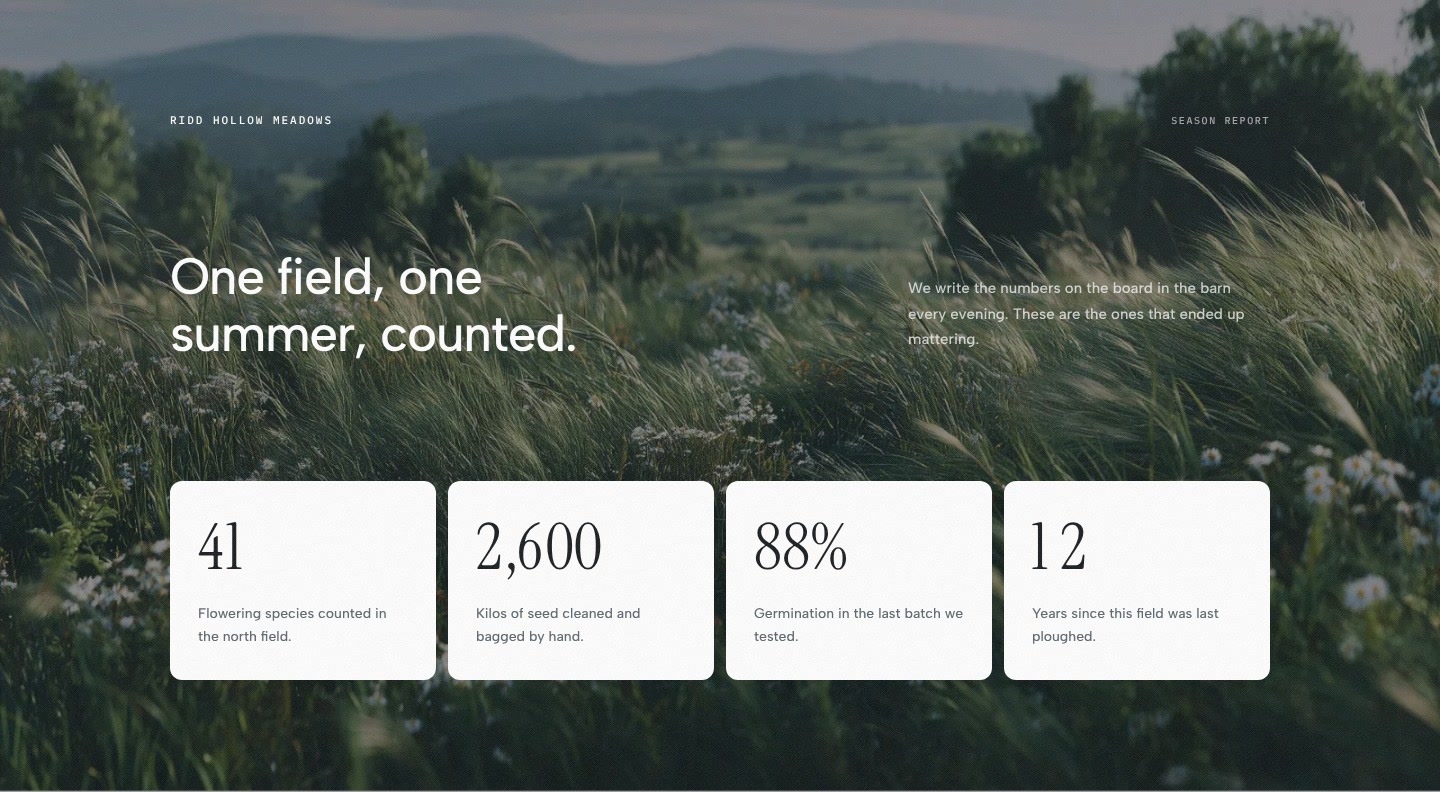
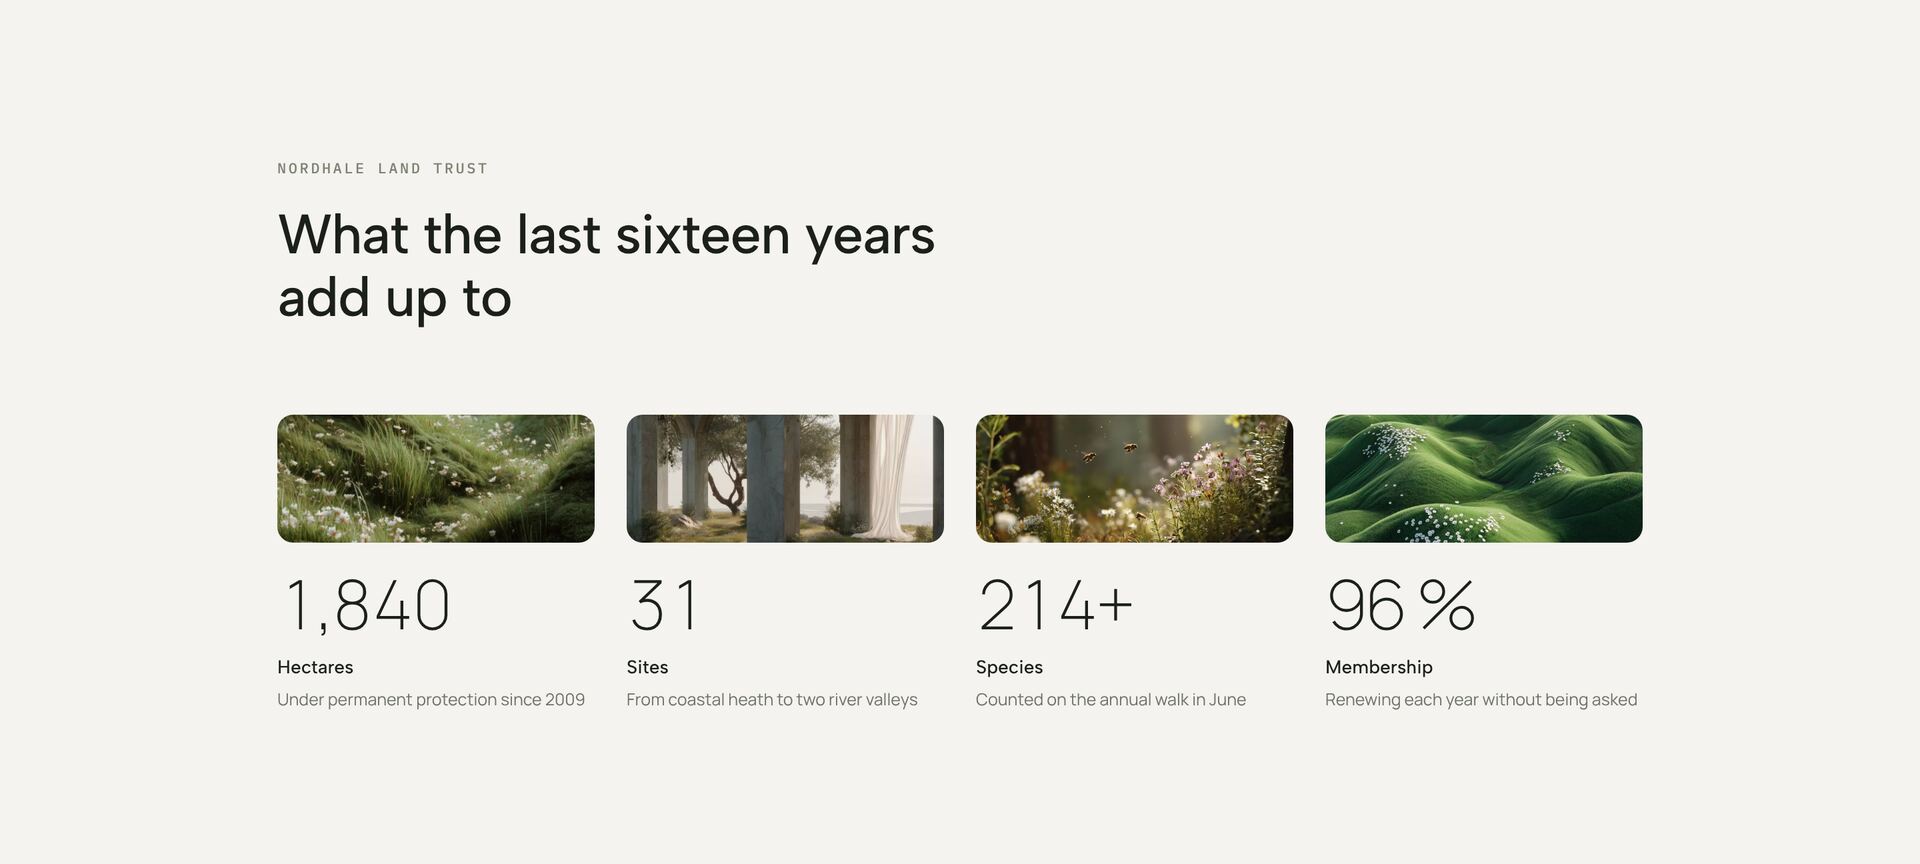
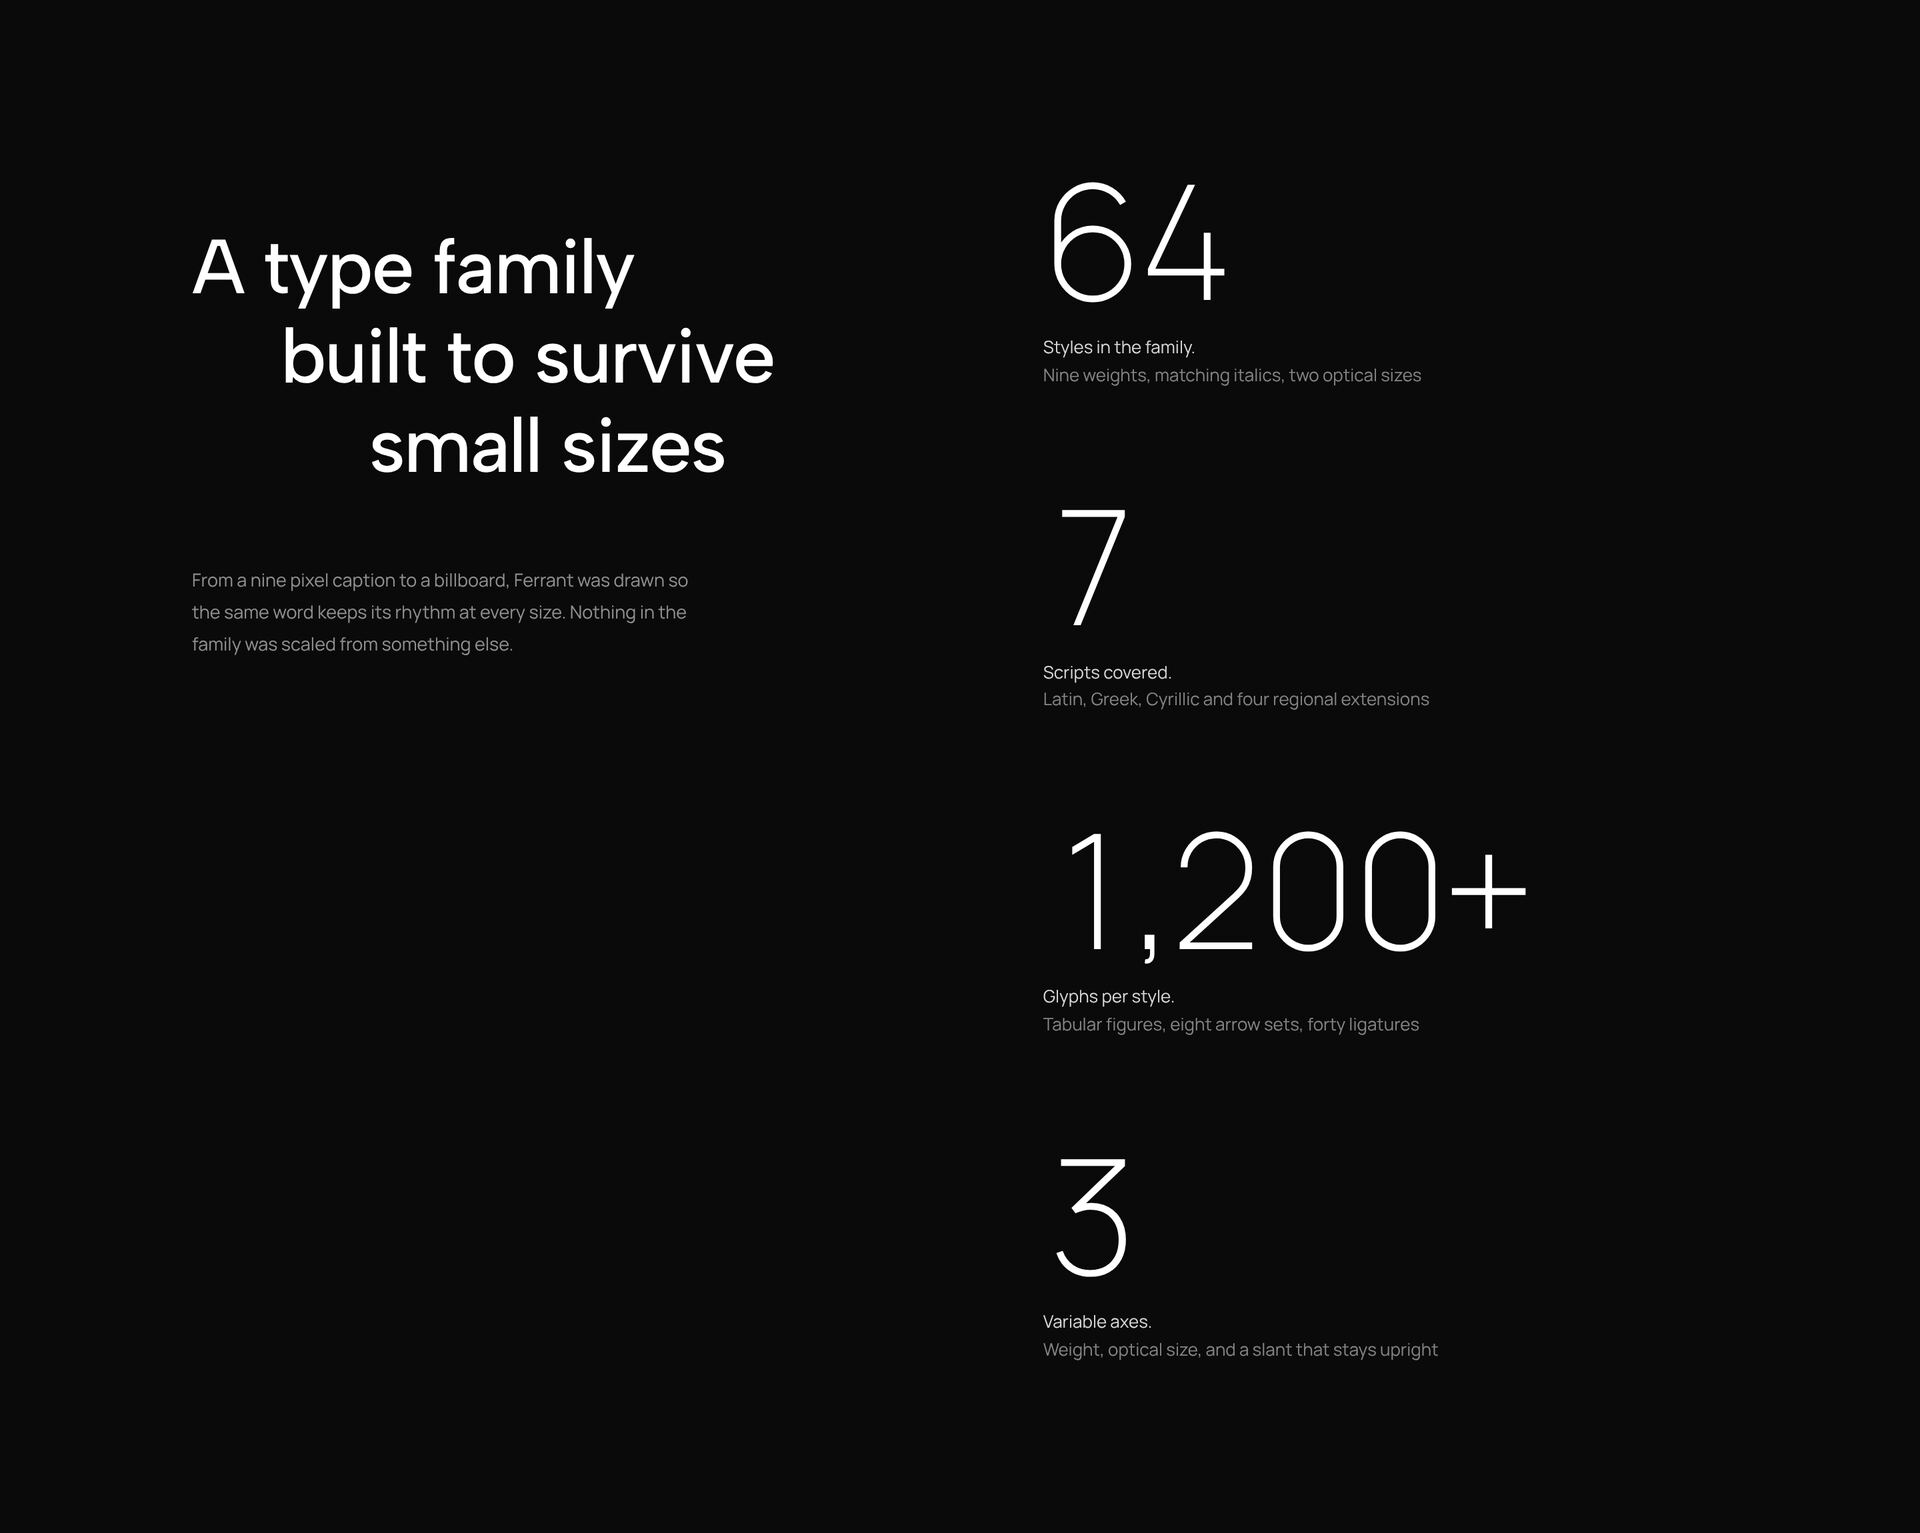
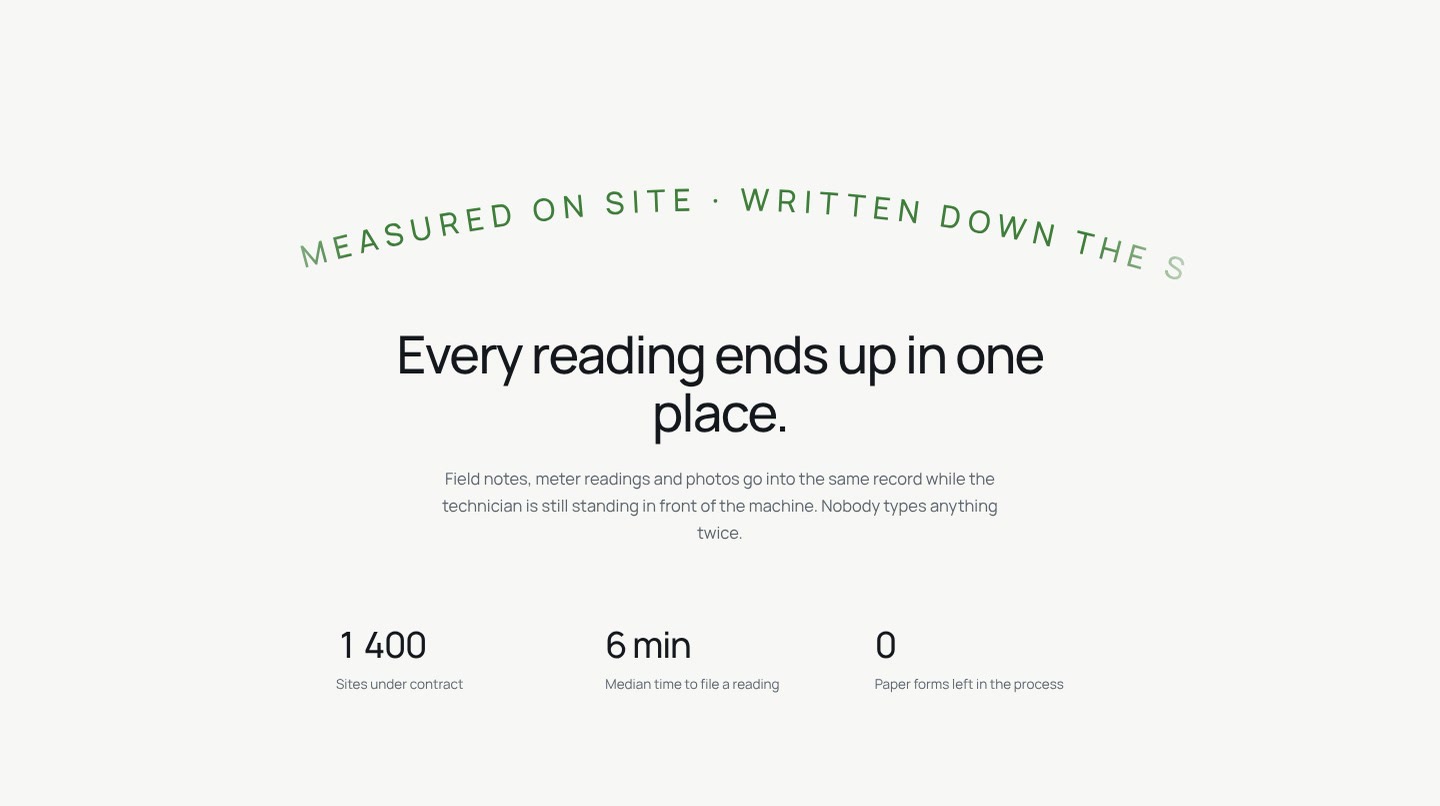
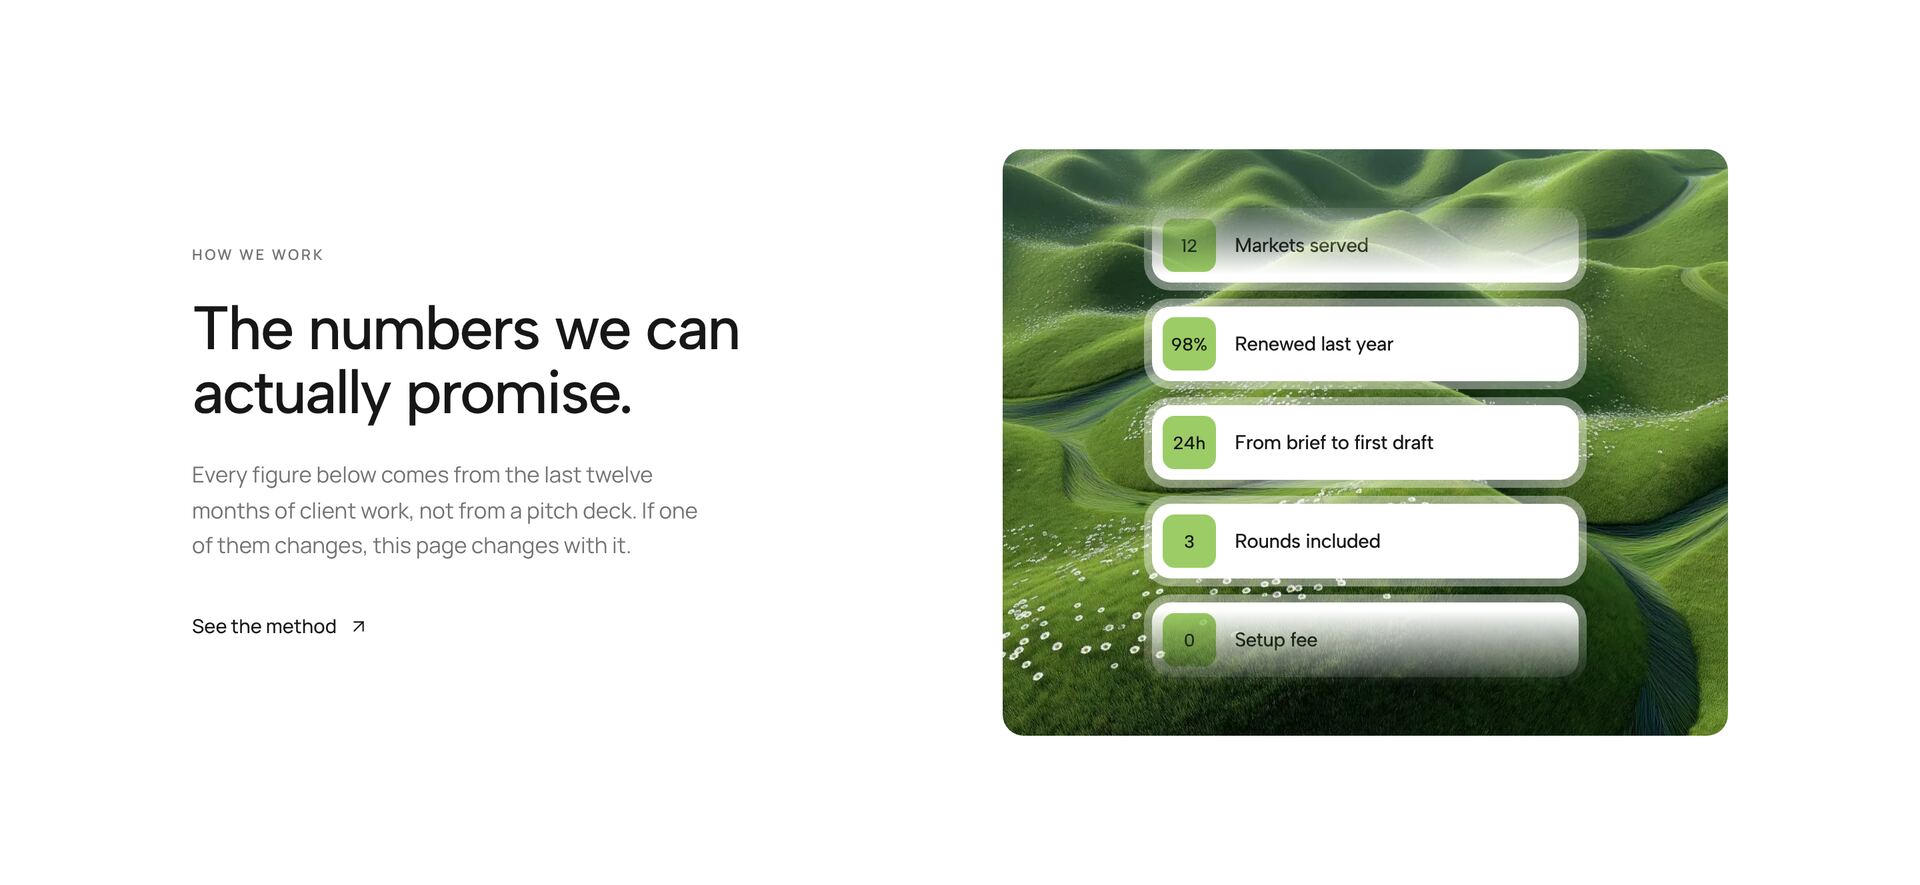
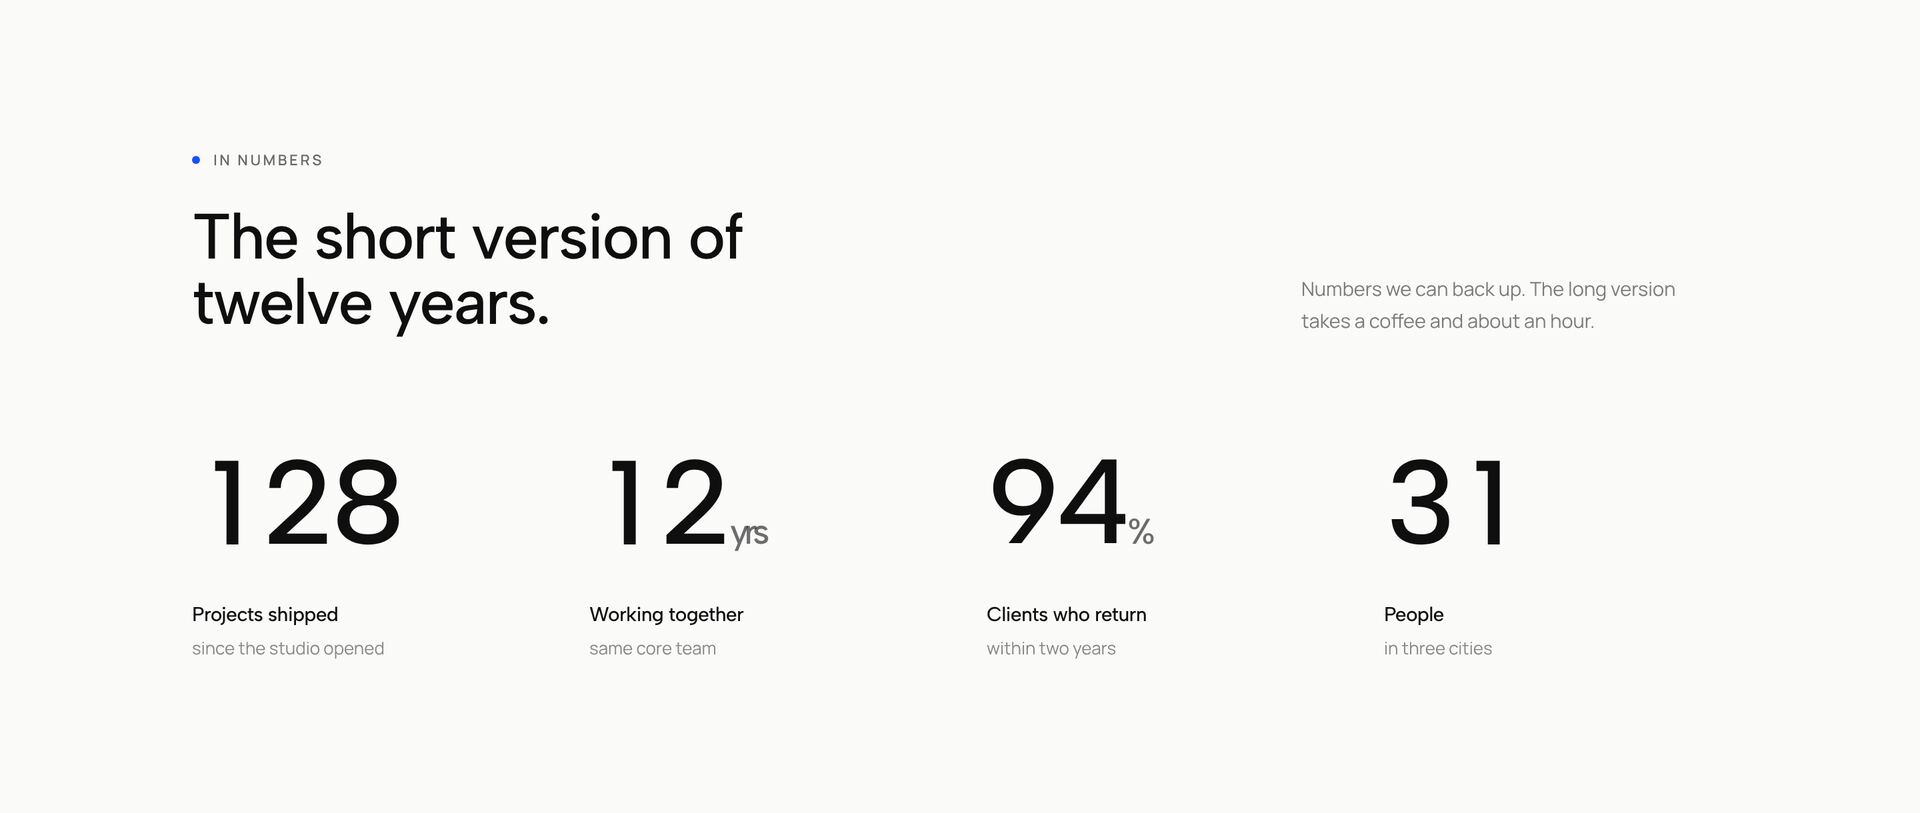
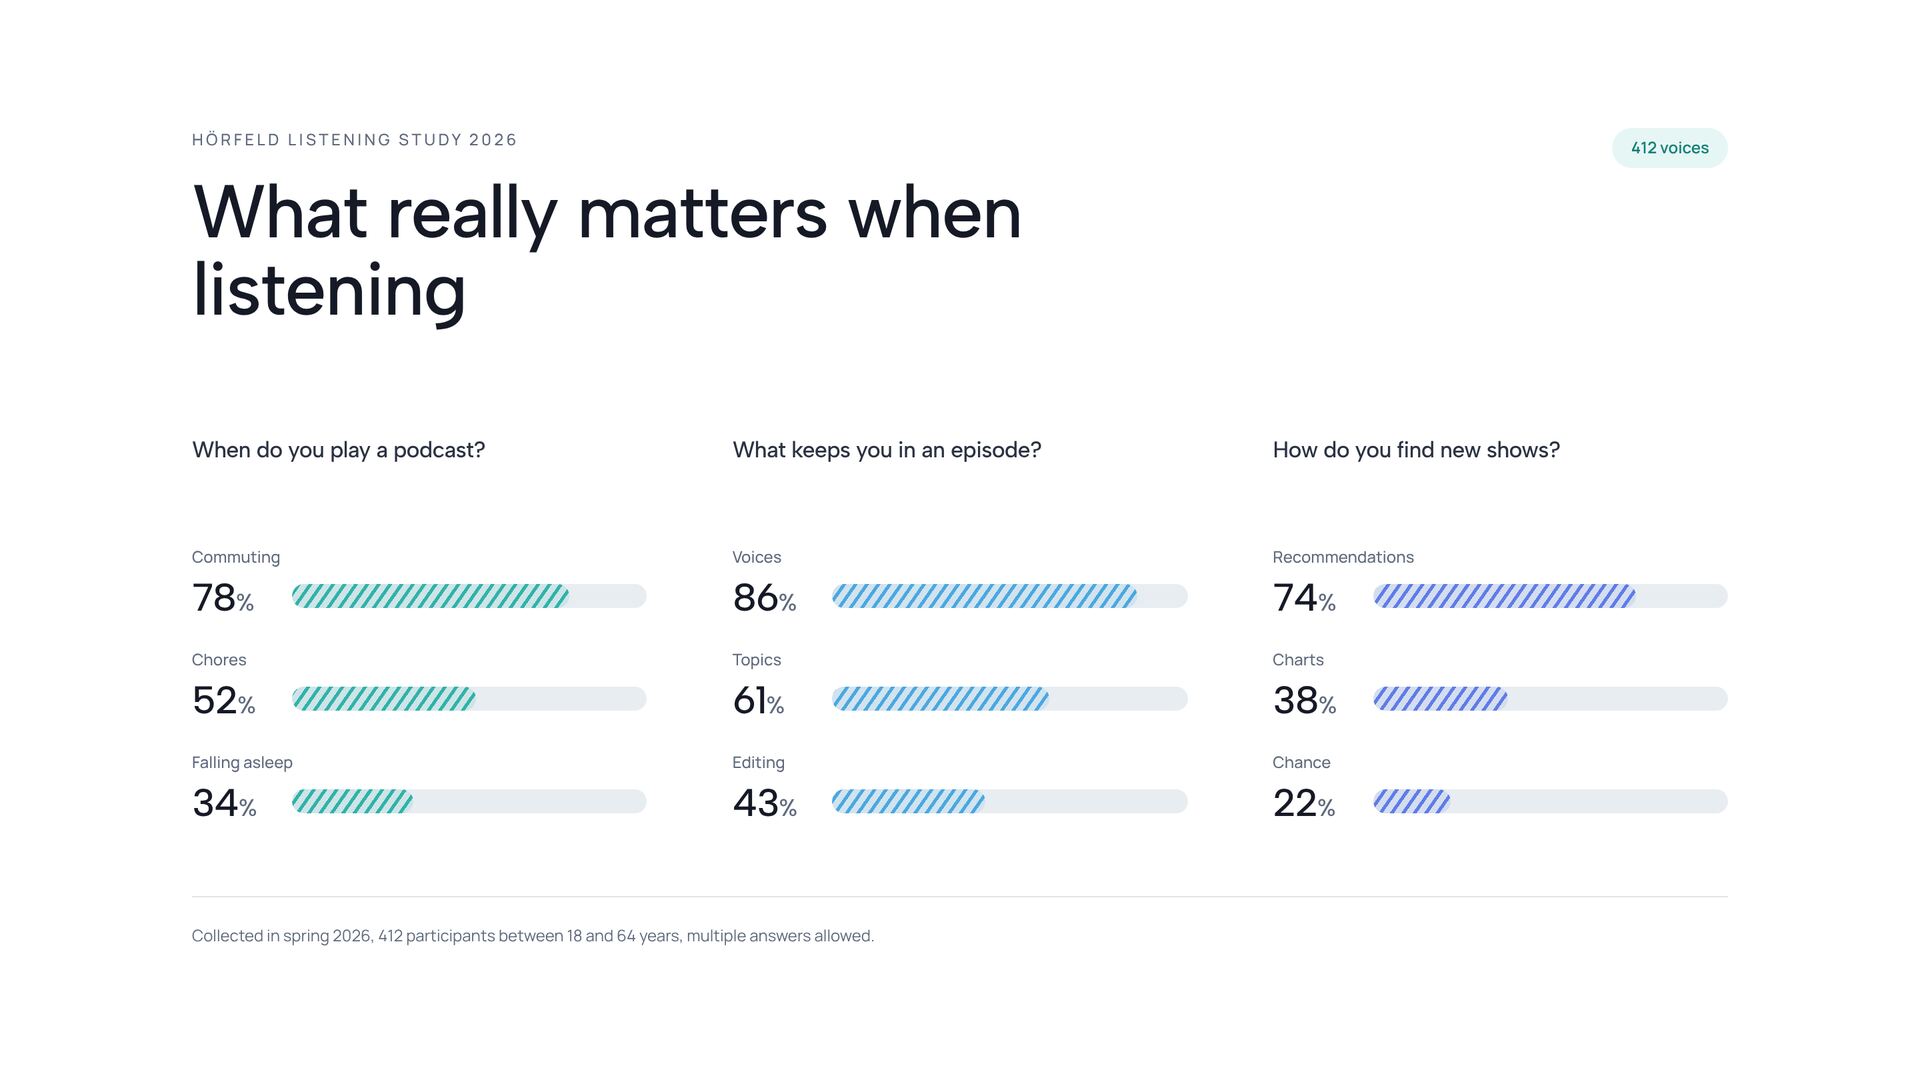
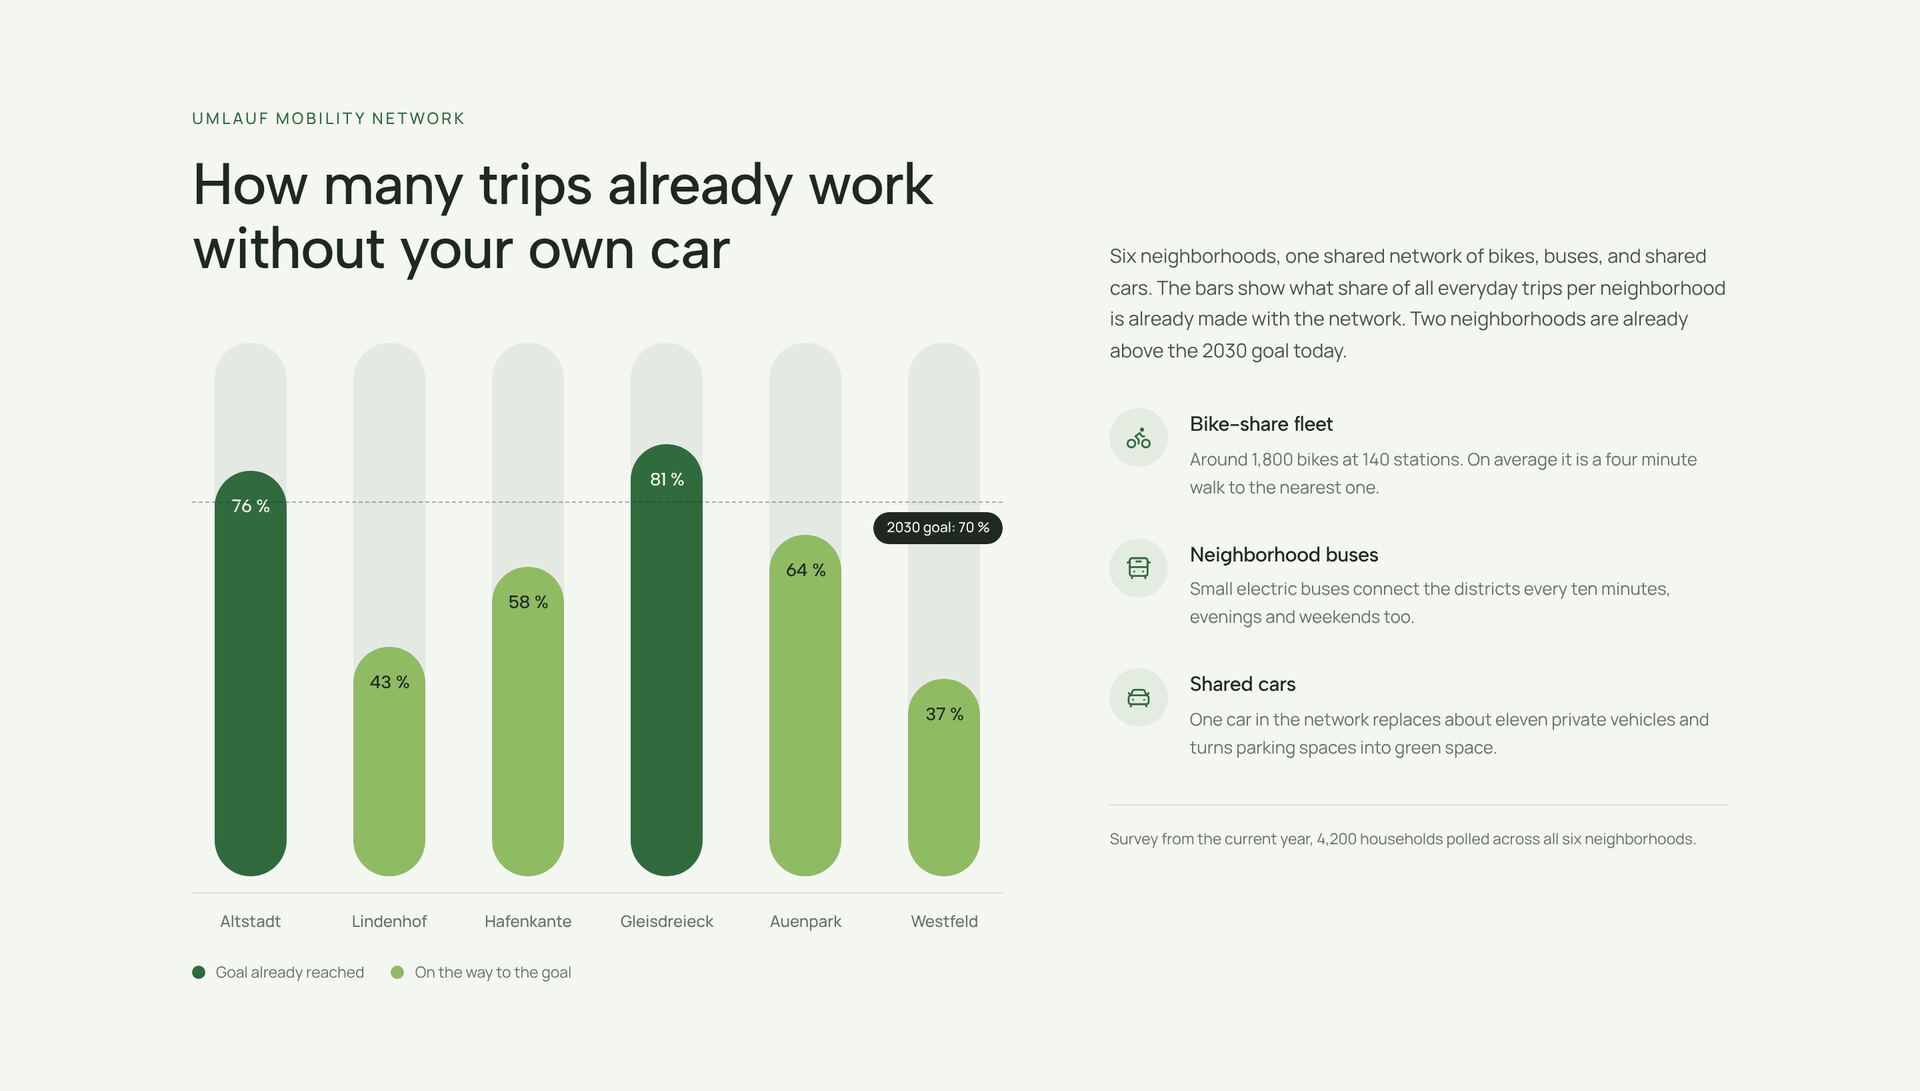
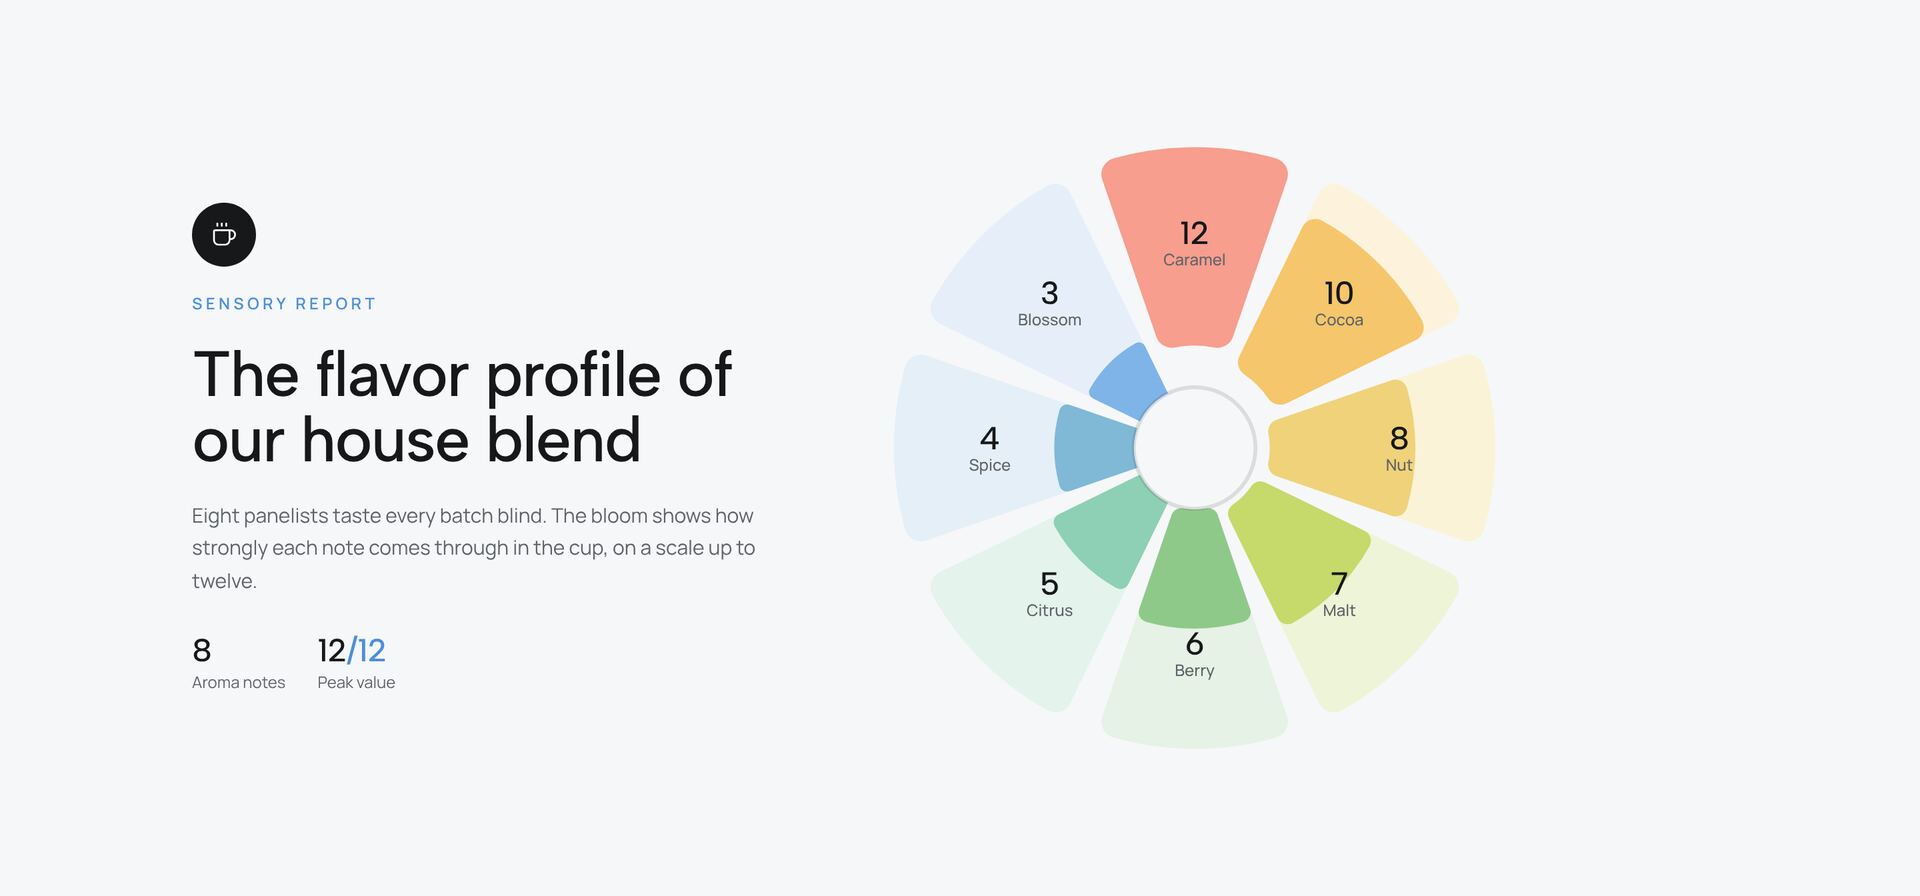
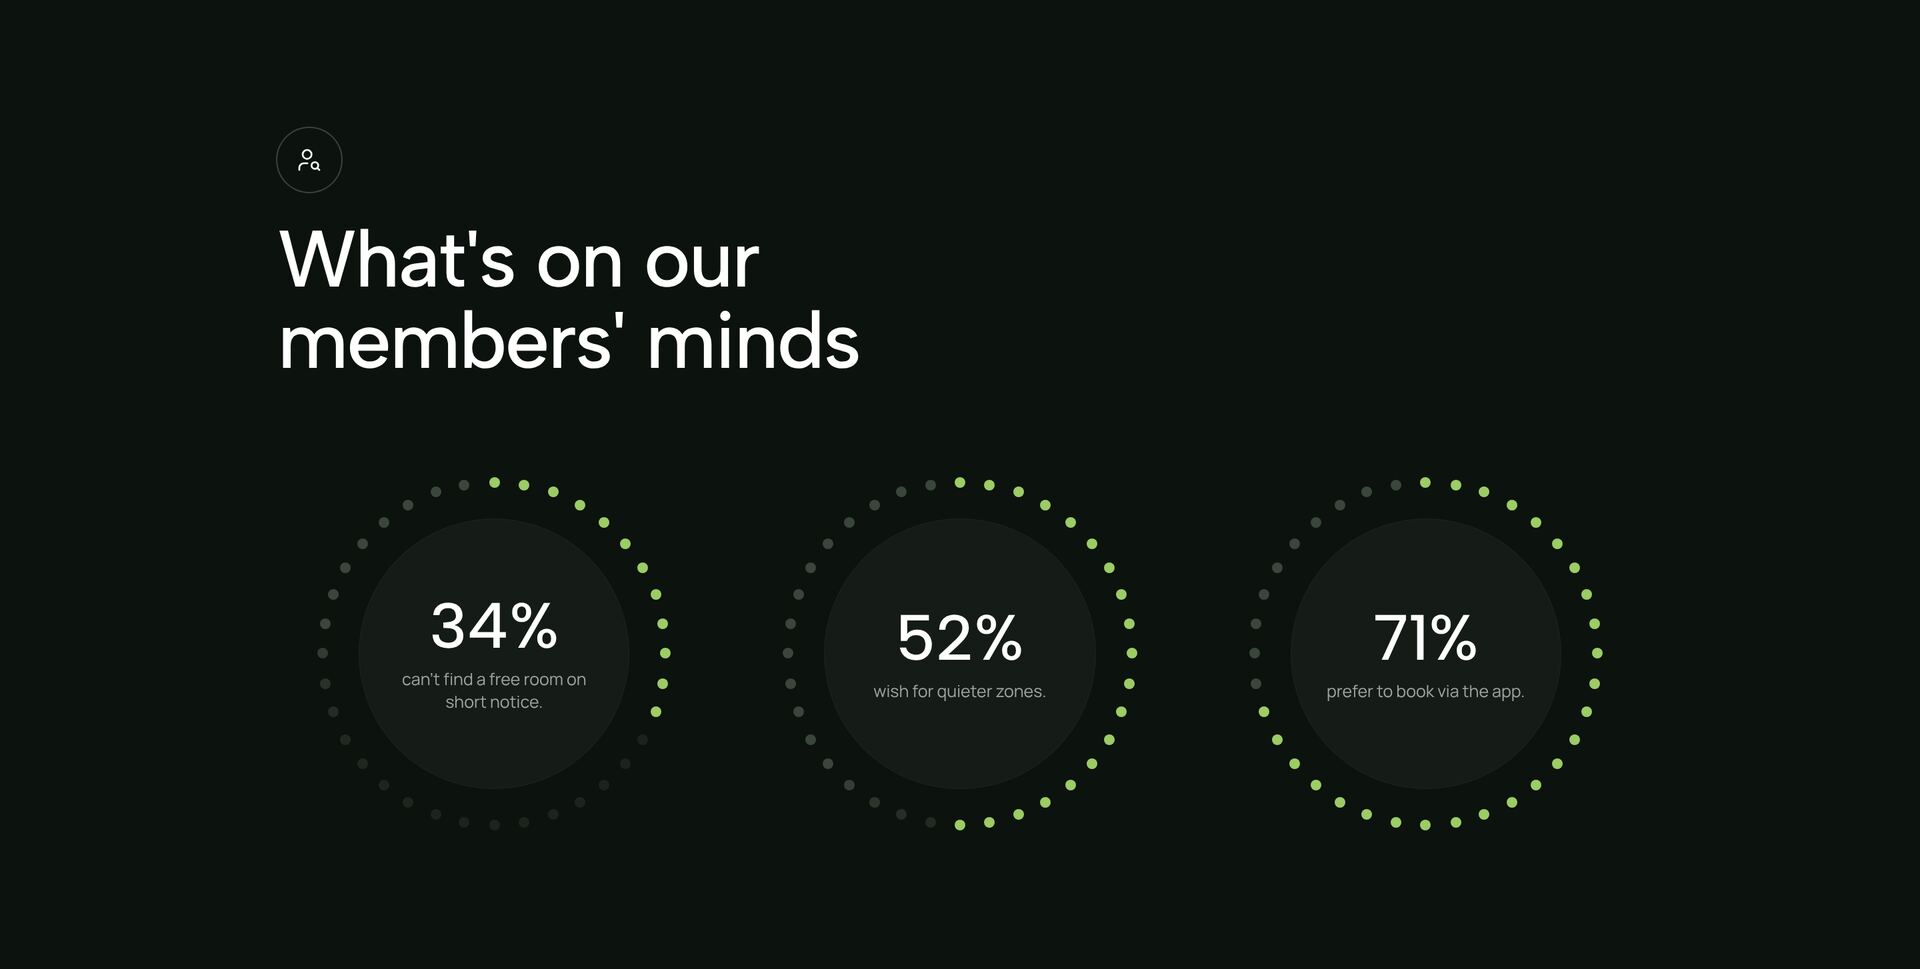
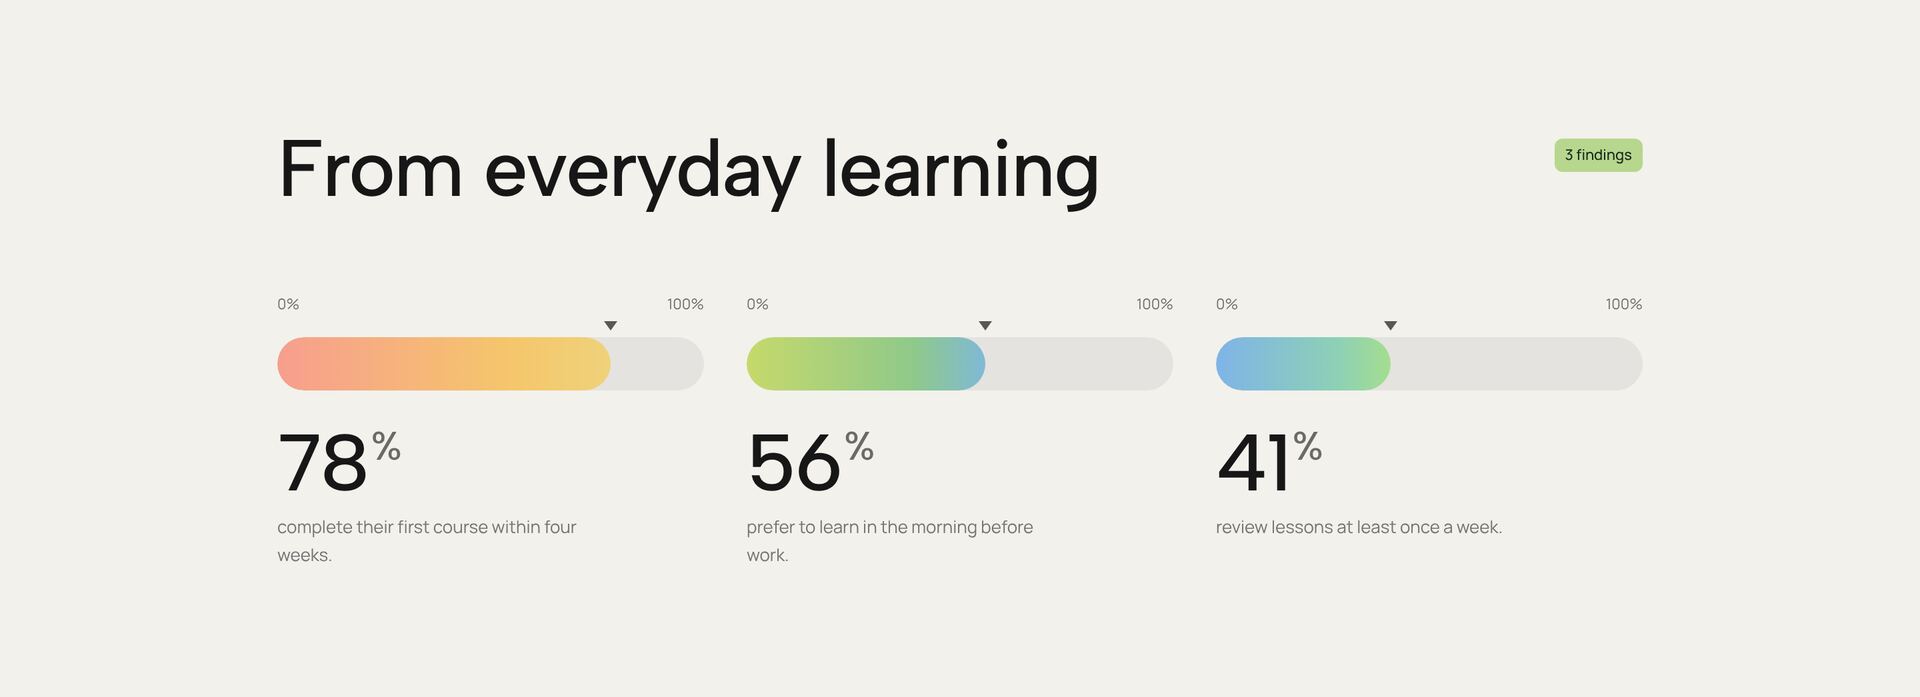
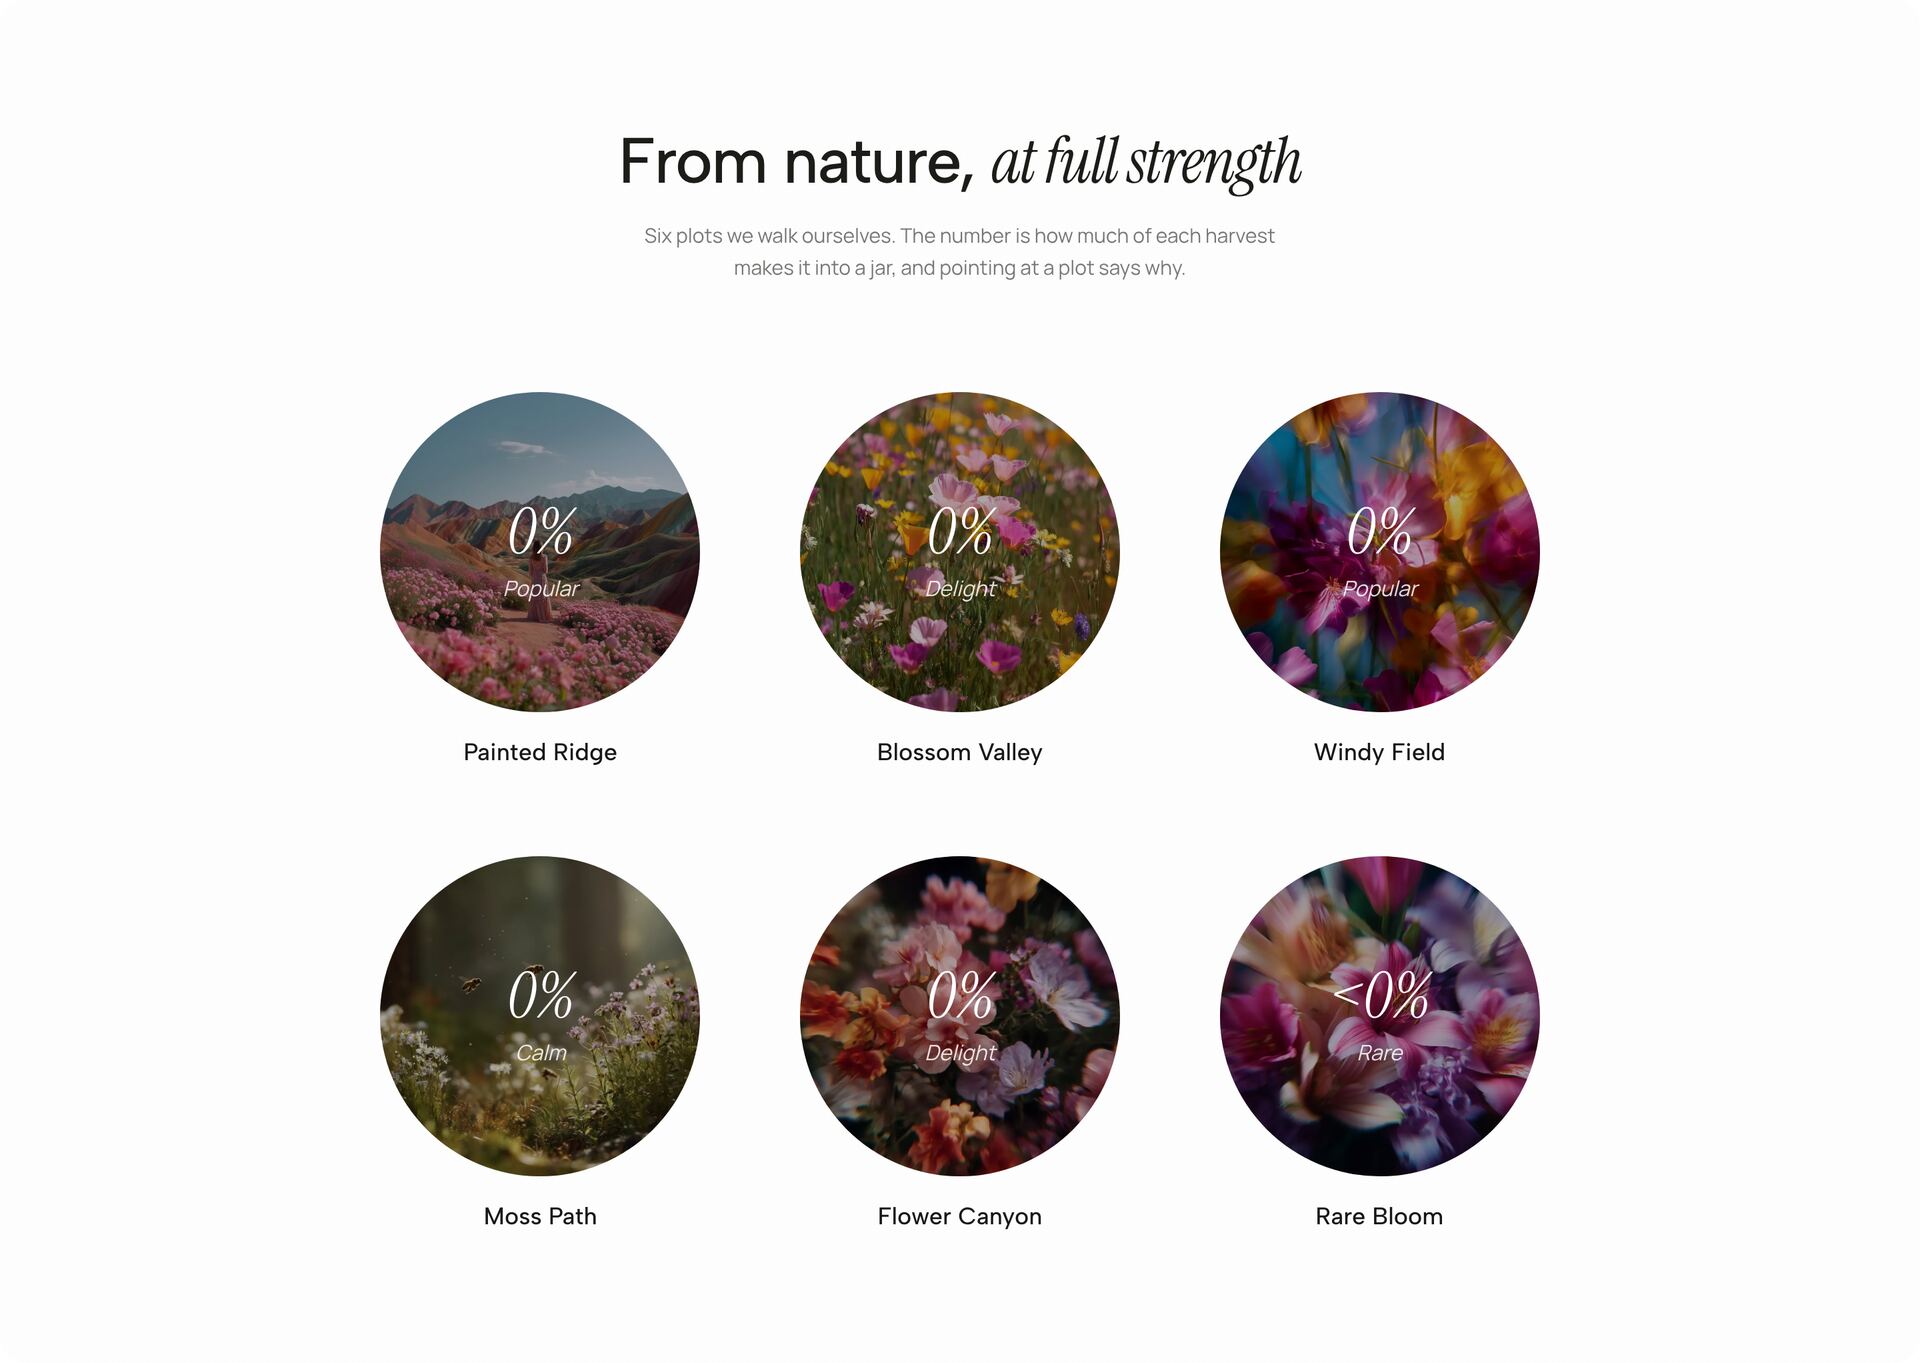
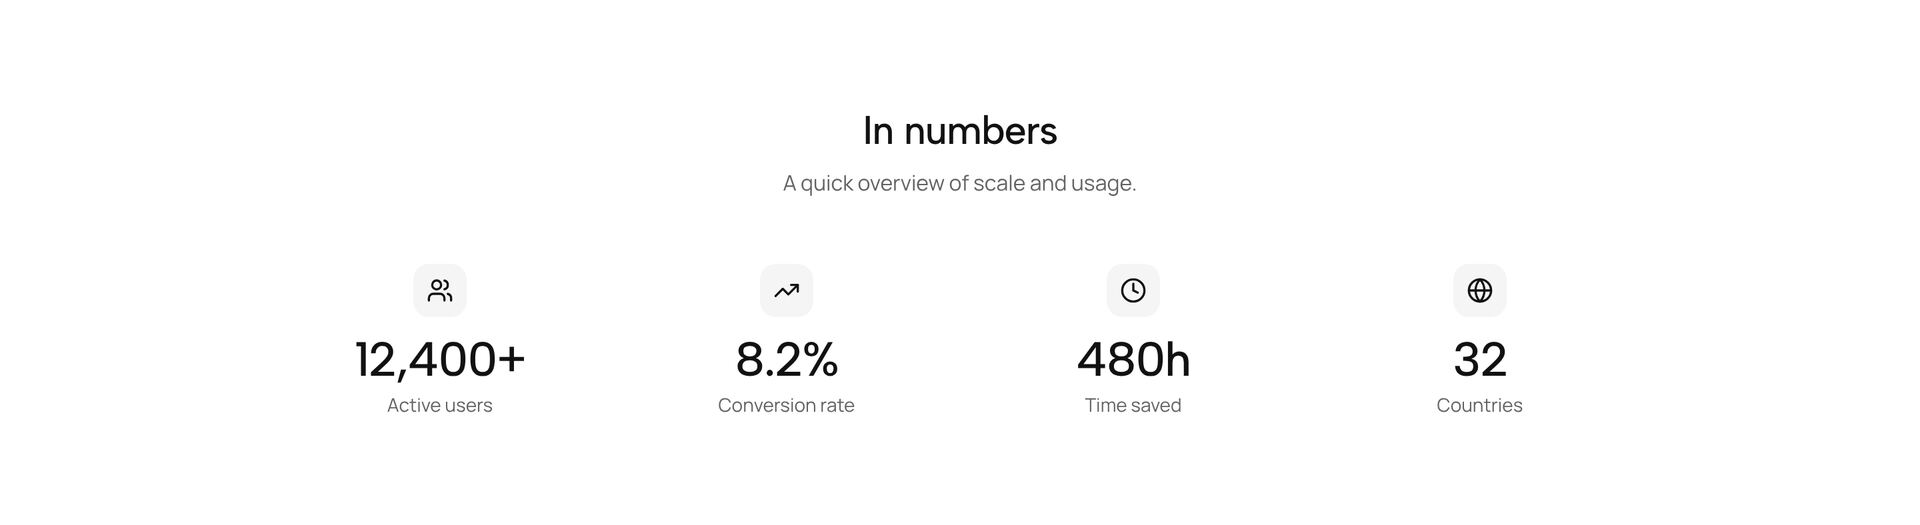
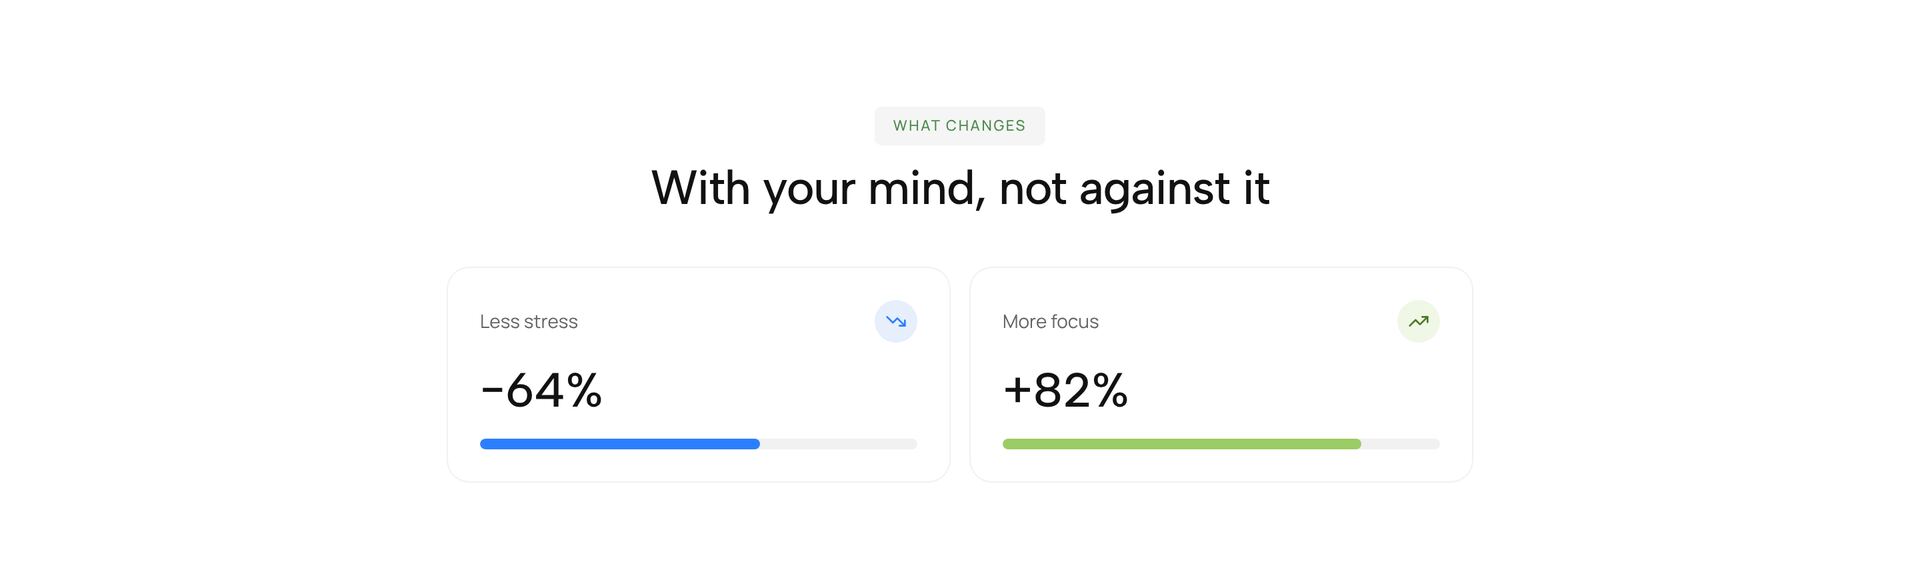
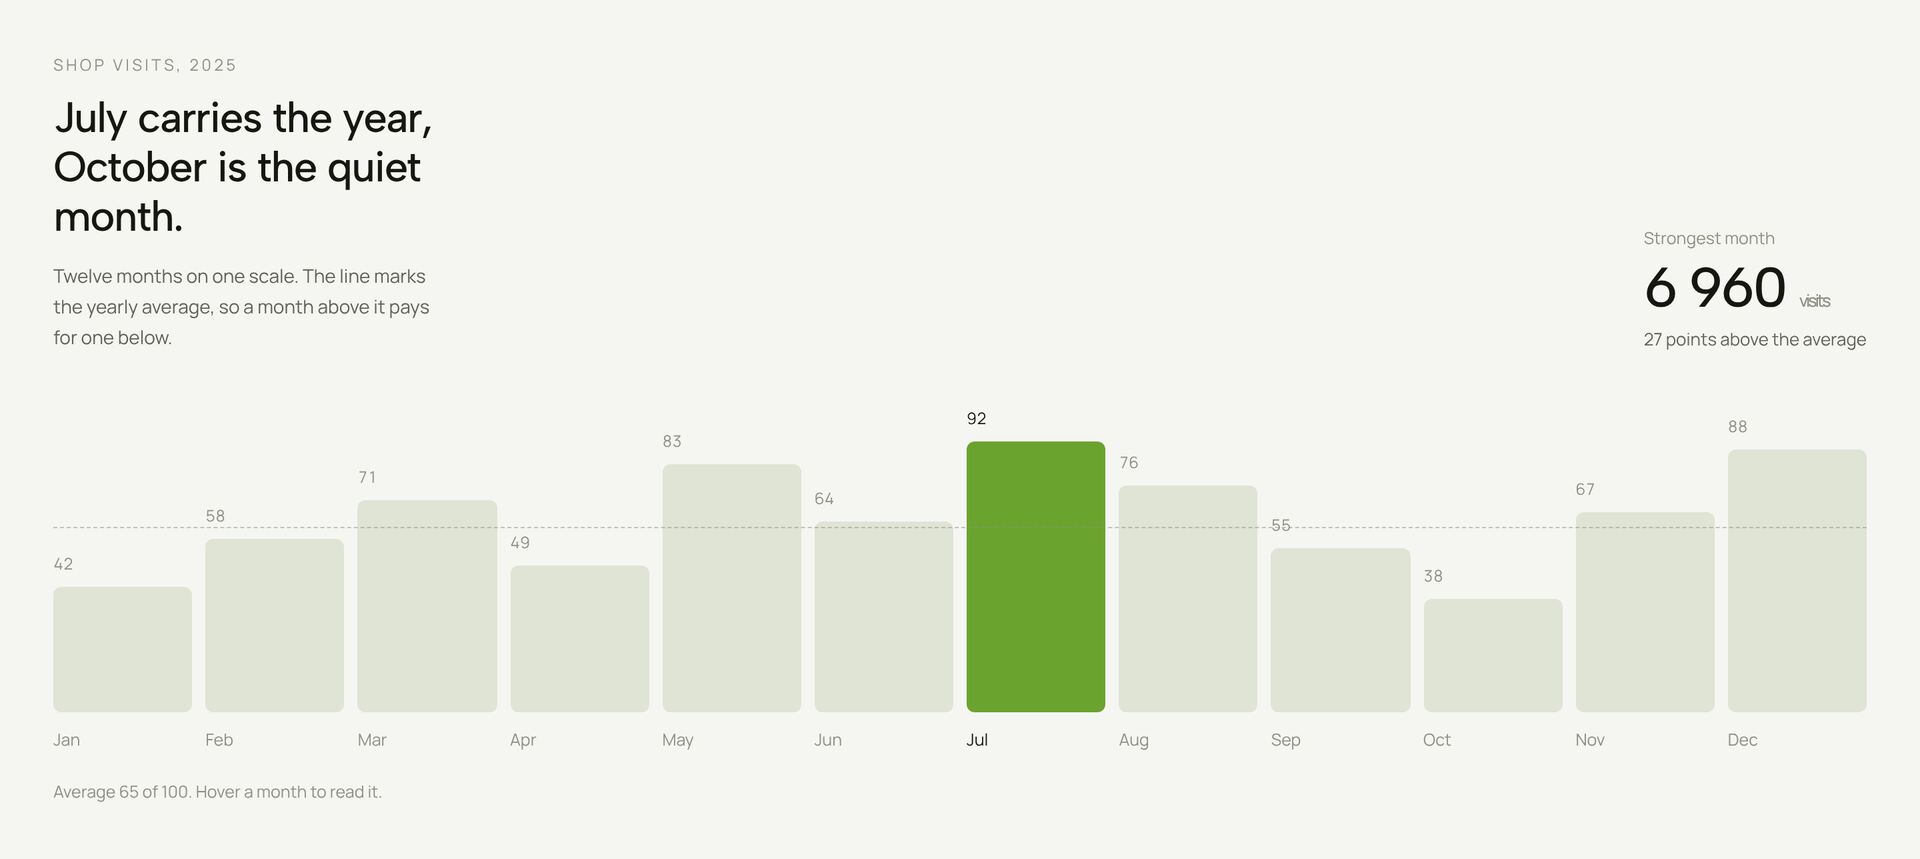
A stats section turns claims into proof: 1,200 clients, 98 percent delivered on time, 4.9 out of 5. The sections here show numbers as a simple band, cards with photos, counters that roll up when they come into view, rings and bar charts, a dot matrix, or a sentence with the numbers set into it.
Three to four numbers are enough. Choose figures visitors can relate to, give each a short label that says what is counted, and round honestly. A number without context, such as “500+”, says less than “500 kitchens fitted since 2012”. Counters and charts run once and show the final value right away when reduced motion is on. Each section is a single React file with Tailwind classes.
More section categories
Frequently asked questions
The ones your buyers ask about: how many customers, how long you have worked, how fast you deliver, how satisfied people are. Three or four, each with a label that says what is counted.
Yes, slightly and honestly. 1,200 reads easier than 1,187, 98 percent clearer than 97.6. Rounding up beyond the real value costs trust once someone checks.
Yes. With reduced motion turned on, counters and charts show their final value without animating.
Didn't find your question? We're happy to help.
Get in touch